Tacton Behavior & Engagement Analytics: Unlock CPQ ROI and Better Sales Performance
Strong CPQ adoption drives real ROI. Tacton Behavior & Engagement Analytics provides CPQ usage dashboards directly in the platform to track user behavior and uncover opportunities to improve performance.

Companies deploying CPQ solutions report an average of $6.22 returned for every $1 invested over a three-year span and yield an average ROI of 121%, according to Nucleus Research.
That level of ROI, however, is only achievable when your CPQ usage is firing on all cylinders.
You invest heavily in your CPQ. Implementation and realized business impact can take several months and hundreds of thousands of dollars. Without insights into user behavior and CPQ adoption, CPQ managers can’t see adoption shortfalls that lower win rates, and IT leaders are delegating essential team hours and resources to address data requests.
Tacton Behavior and Engagement Analytics is a CPQ usage analytics dashboard tool that simplifies visibility into CPQ adoption and user engagement, directly within Tacton CPQ. Tool owners can identify bottlenecks and issues early to determine the best course of action, so they can enhance performance across the organization and improve time-to-productivity.
What is Behavior & Engagement Analytics?
Available for free to all Tacton users, this CPQ behavior analytics tool helps your teams get the most from your CPQ without custom coding or heavy IT requirements. Pre-built dashboards, flexible filters, and automatic adoption alerts allow users of any technical level to get immediate visibility into a number of metrics across teams, regions, and channels.
Tacton CPQ owners and admins can use these dashboards for the following:
- Early intervention: Historical trends reveal where CPQ usage begins to decline across sales, partner, or engineering roles. System owners can act before adoption problems impact quote volume or accuracy by adjusting workflows or reinforcing enablement.
- Targeted training: Low-adoption users or roles are automatically flagged for review. Admins can use this data to focus training efforts where they’ll have the most impact, ensuring teams understand how to create proposals effectively. Doing so results in improved productivity and faster onboarding for new or underperforming users.
- Cross-team benchmarking: Compare adoption across sales teams, business units, or regions using built-in filters. Identify where engagement is strongest and where additional support or best-practice sharing is needed to replicate high-performing teams’ behaviors and close adoption gaps across the organization.
- Self-service rollout tracking: When a new self-service channel is introduced within Tacton CPQ (i.e., customers or partners to configure products and request quotes directly), system owners can monitor how many configured products, shopping carts, and proposal documents are created and enable faster validation of digital initiatives and data-driven improvements to self-service performance.
“When implementing a CPQ, it’s mainly about the users and efficiency, but that means users are creating a lot of valuable data. It’s really important to have good analytics capabilities to get insights from this,” states Patrik Östberg, SVP of Product Management at Tacton.
How to track CPQ adoption using Behavior & Engagement dashboards
The Behavior & Engagement Analytics dashboard is easy to use and understand for any user, from a seasoned manager to a new sales rep with no technical expertise required.
Users can effortlessly navigate a variety of charts and CPQ user adoption metrics, including:
Created content by object type
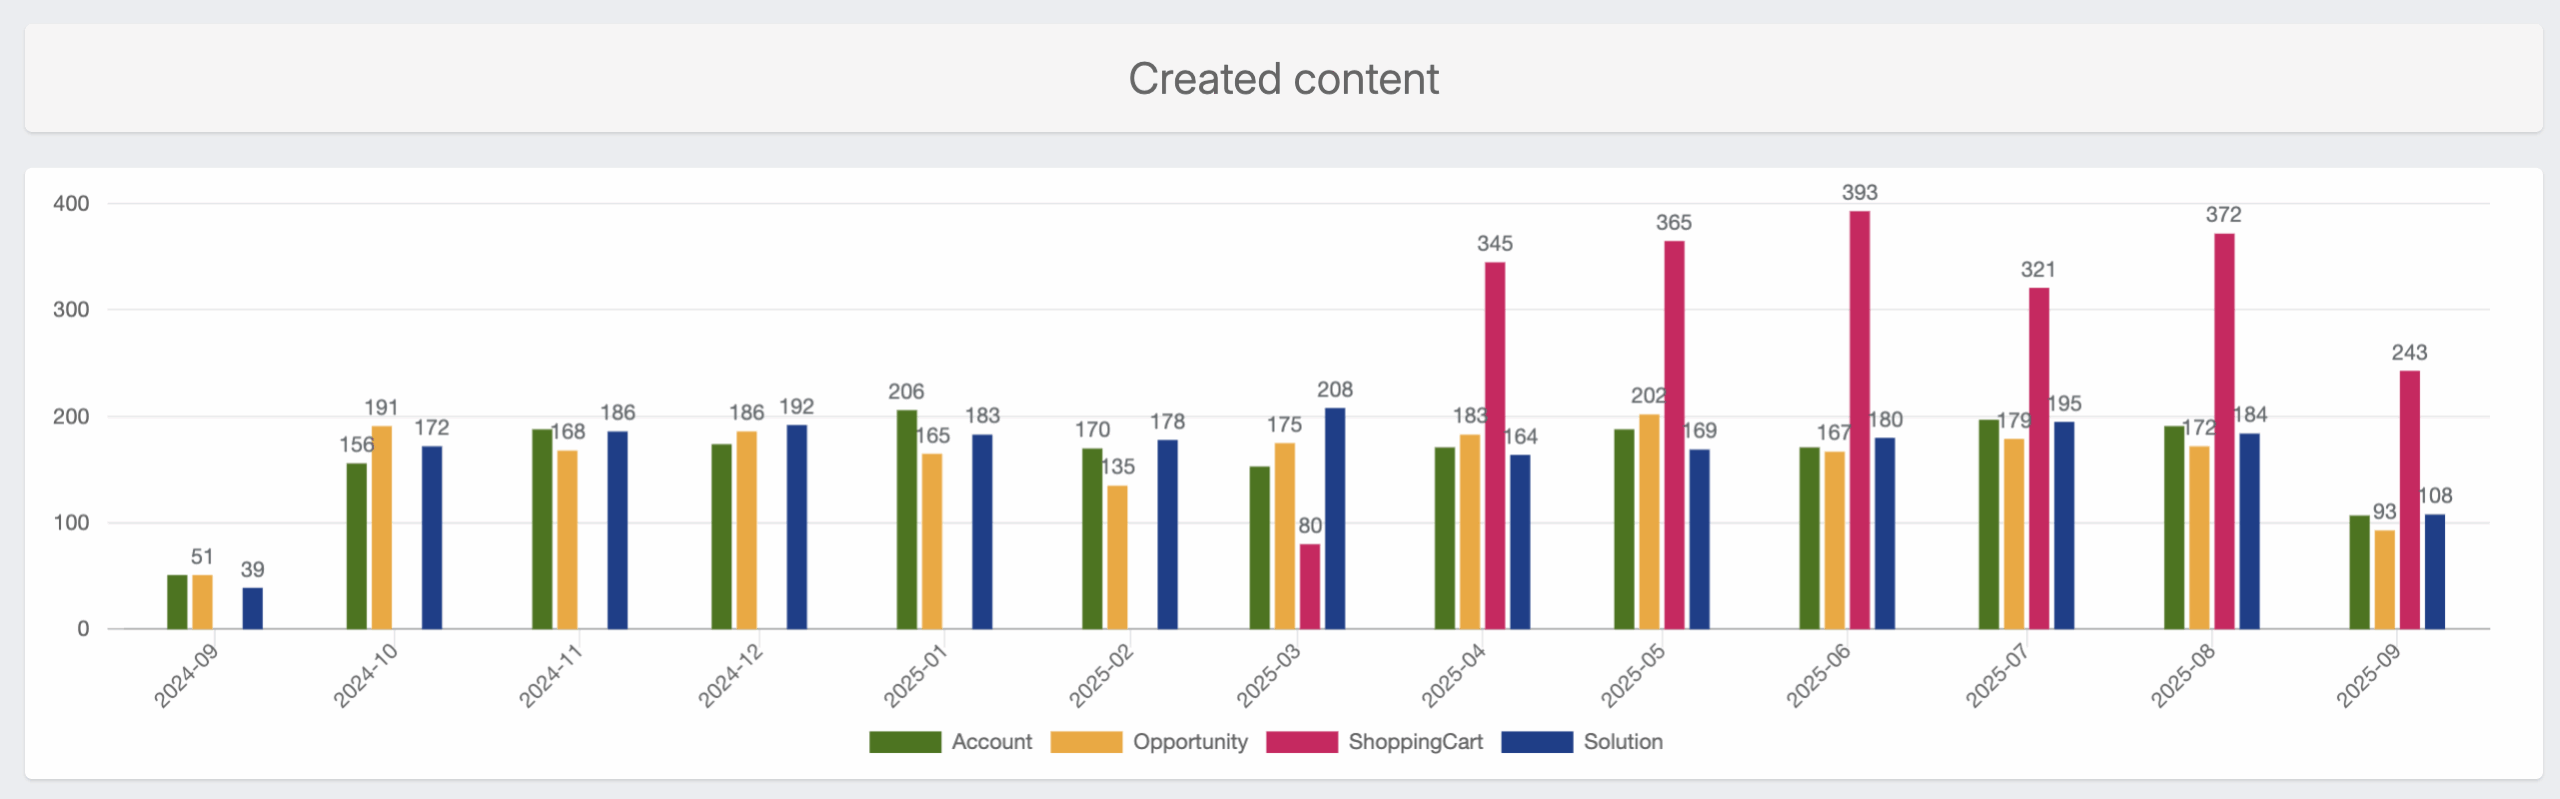
This chart shows how many CPQ objects (e.g., accounts, opportunities, shopping carts, and completed solutions) have been created across your company and its sub organizations. For example, an uptick in shopping carts can indicate strong self-service adoption, while steady opportunity creation points to healthy engagement from internal sales. This view makes it easy to compare activity levels and track adoption across roles, business units, and stages of the buyer journey.
Proposals and firm proposals over time
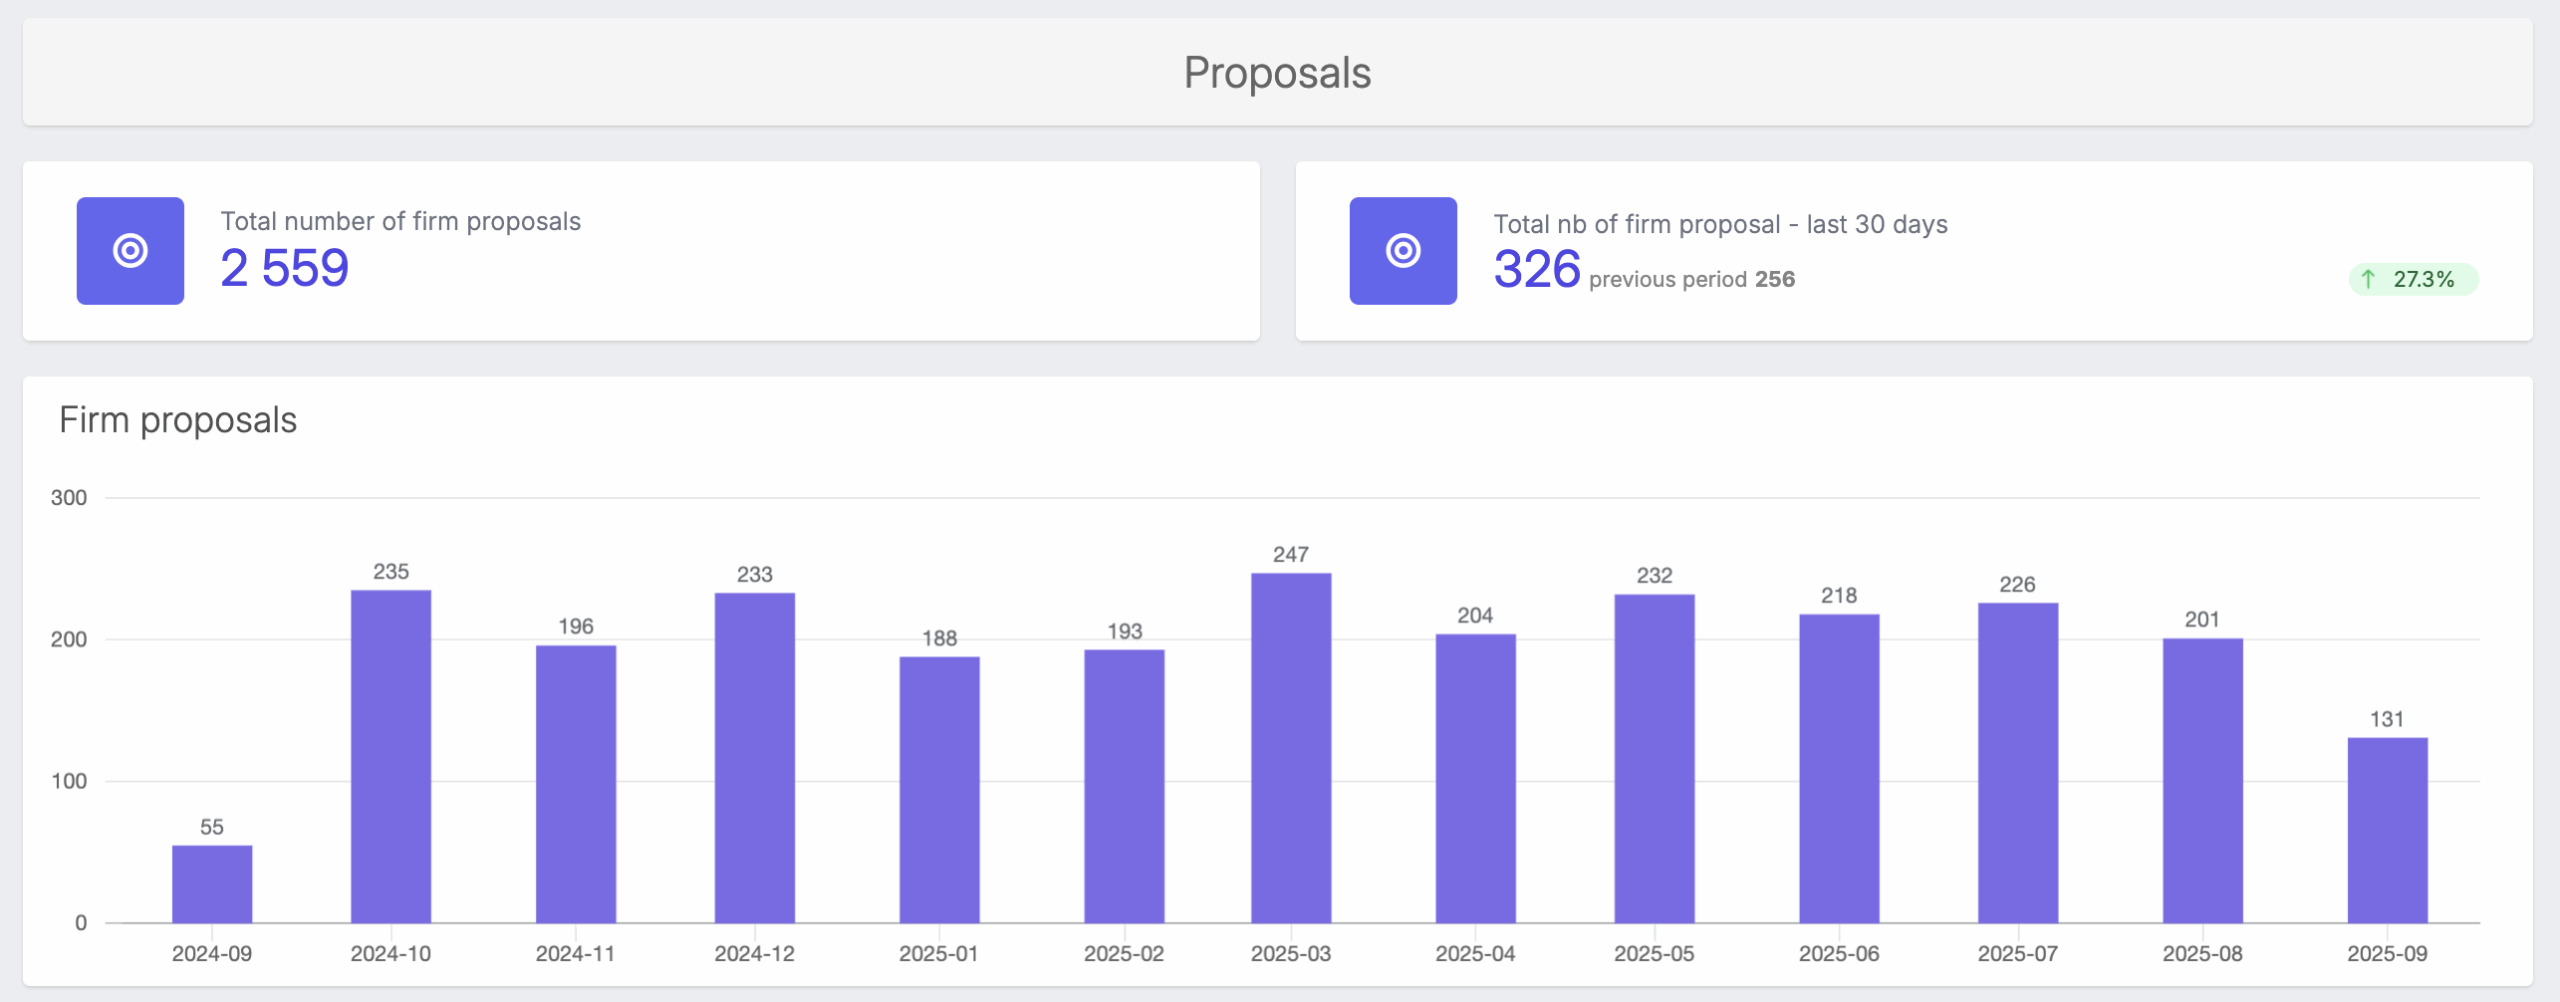
This visualization tracks both total proposals and firm (submitted) proposals over time. It reveals trends in quoting activity and helps spot periods of high or low engagement. Comparing proposal creation to submission rates can surface potential bottlenecks, and low proposal creation could hint at adjustments that should be made within Tacton CPQ to further enable your teams.
Configured products by channel
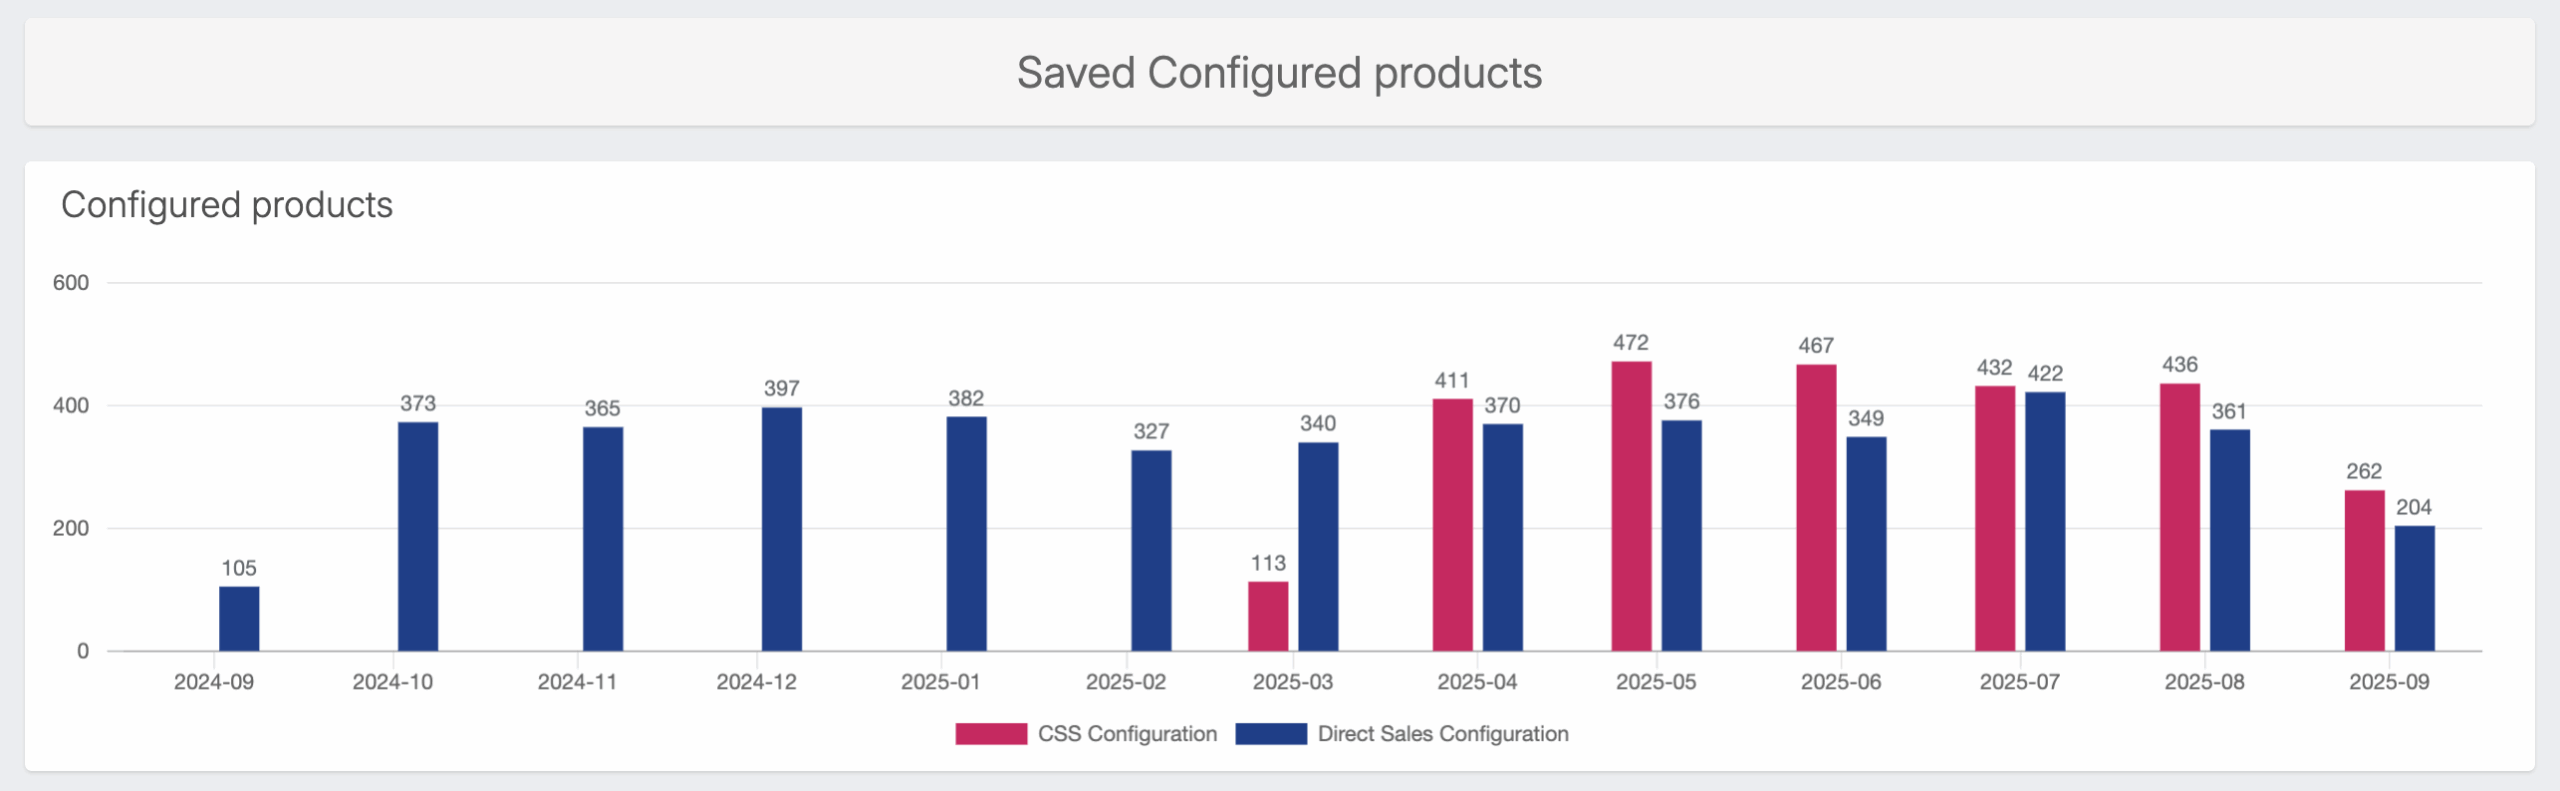
This chart breaks down the number of configured products created across direct, partner, and self-service channels. It shows, for example, who is performing the most configuration lift—your customers or your sales teams? This insight helps teams measure the effectiveness of new digital sales channels and assess where additional enablement or automation could drive greater efficiency.
Registered and active users
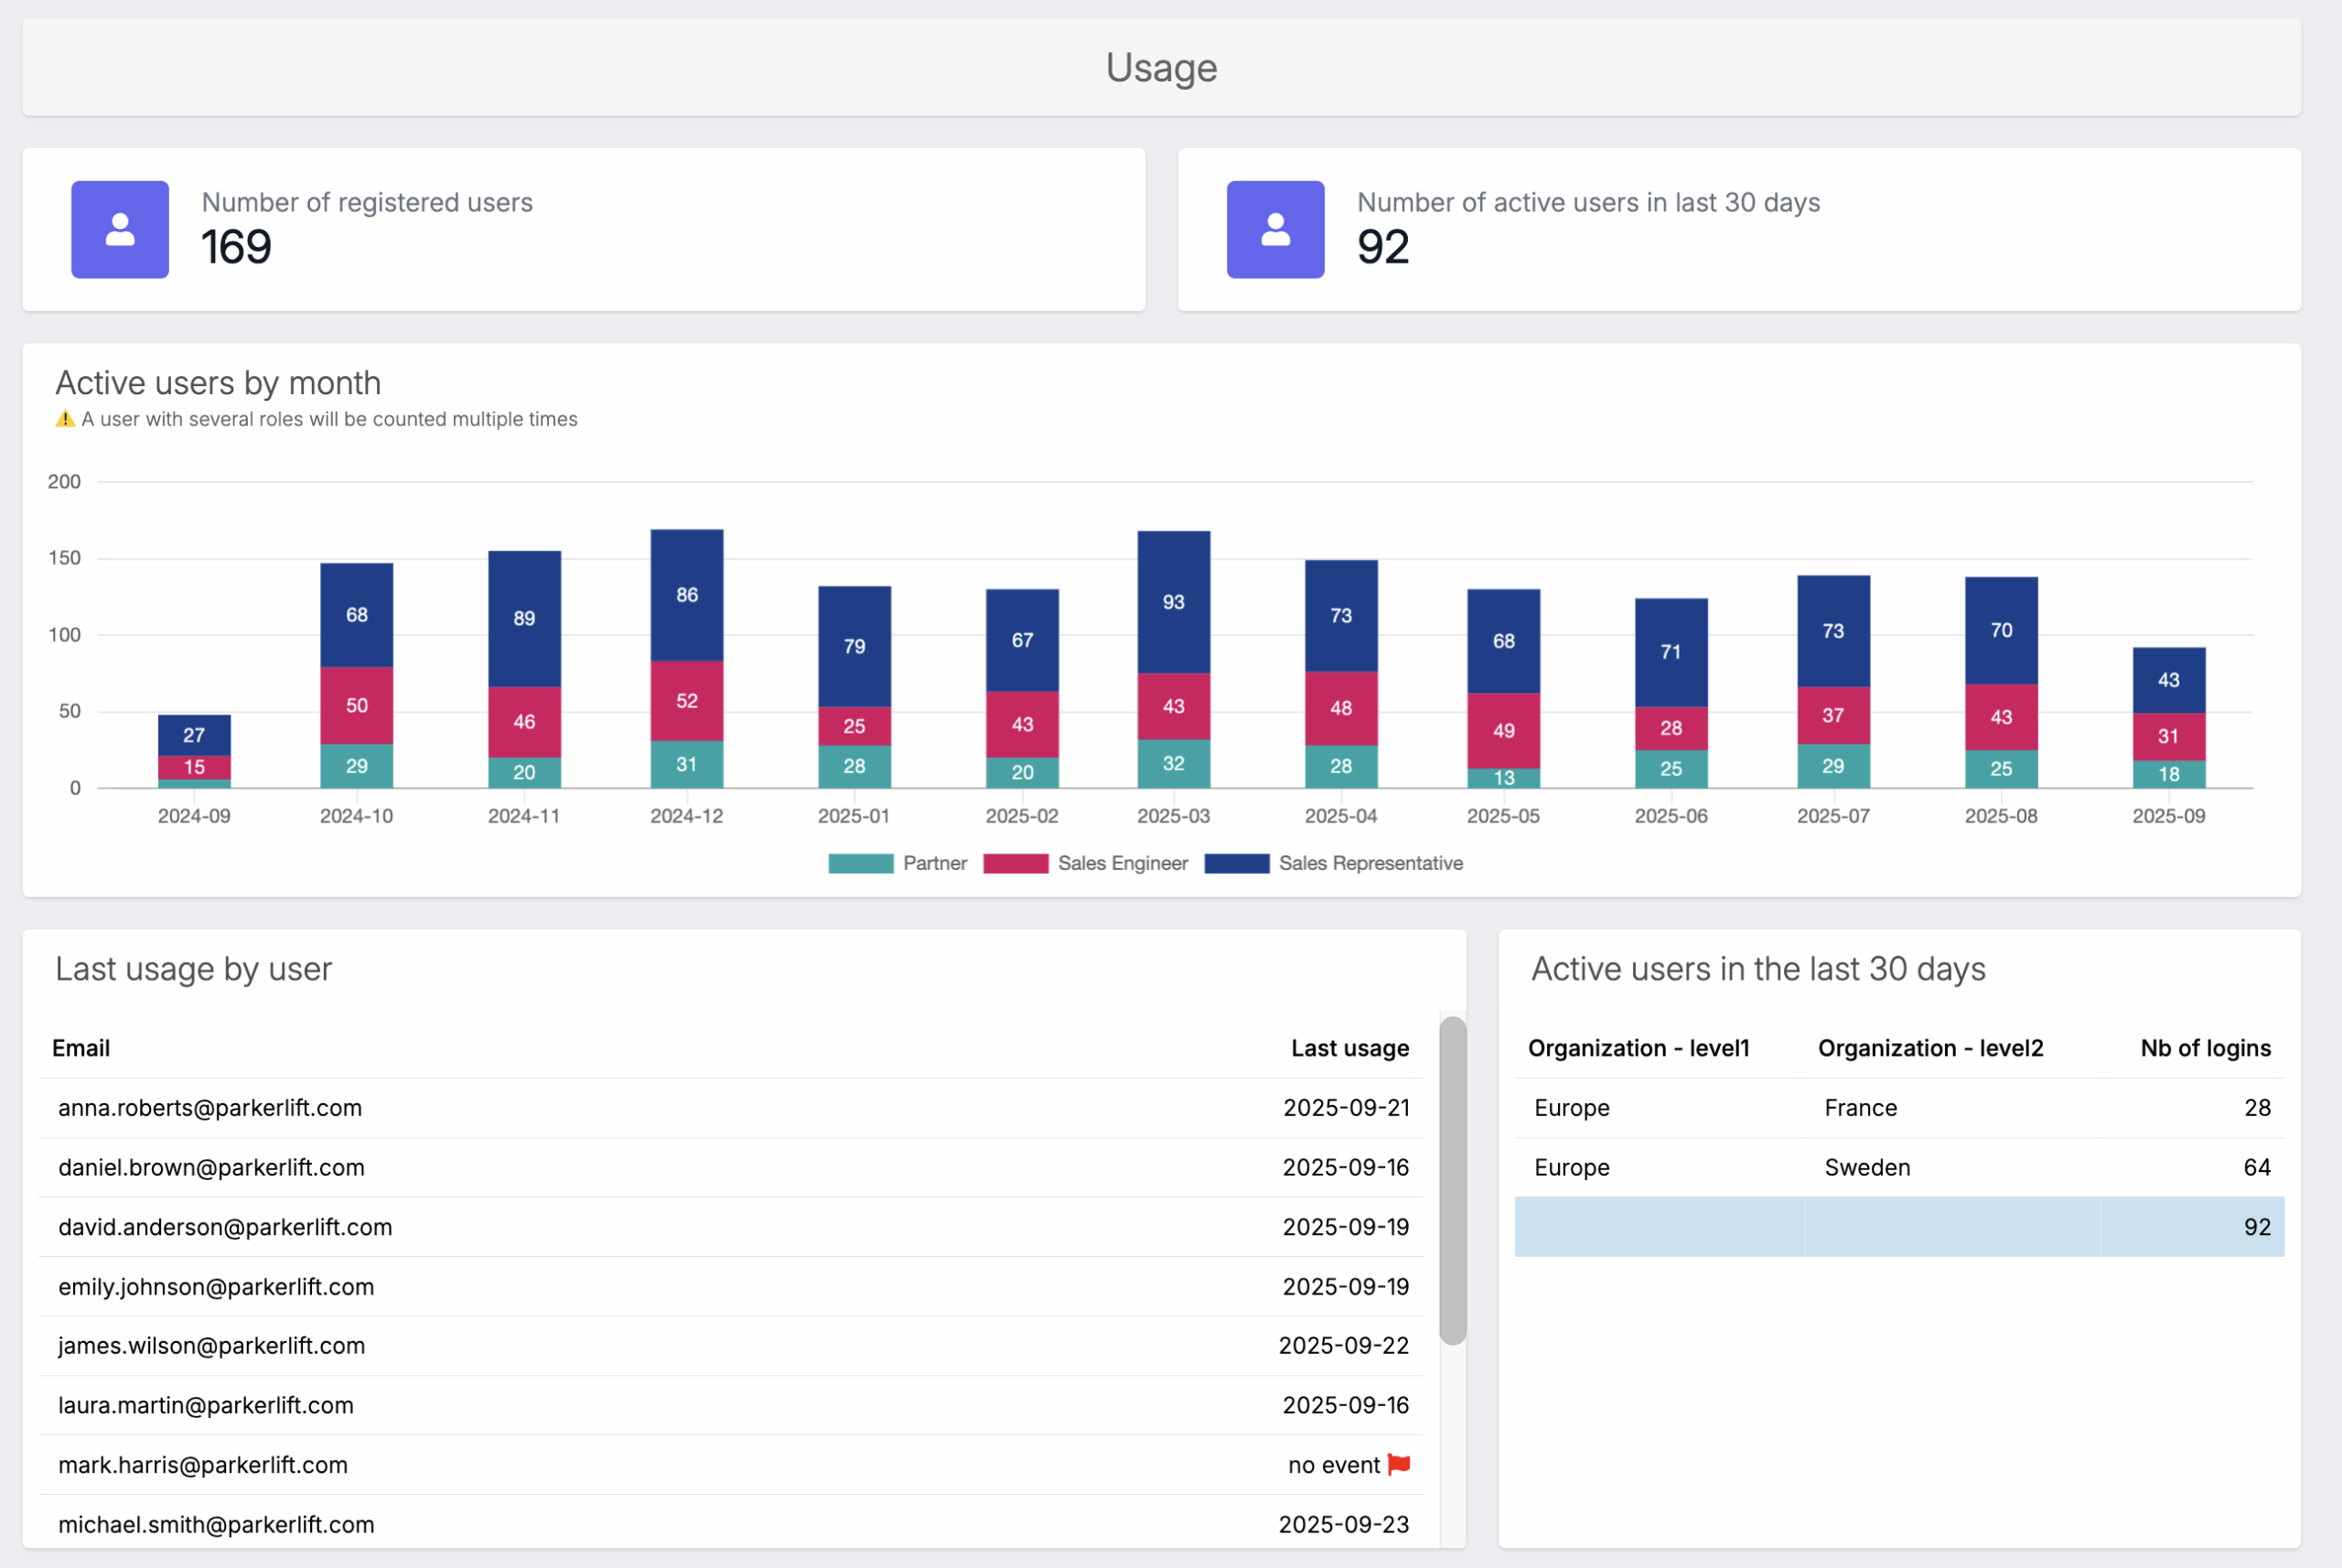
This section tracks the number of registered and active users each month, with filters by role, internal vs. partner, and region. It gives CPQ administrators a clear picture of platform adoption across the organization and helps identify where engagement is strong versus where additional onboarding or communication might be needed.
Last usage by user
Highlight when each user last interacted with Tacton CPQ, flagging in red any users who haven’t logged activity. It enables early detection of disengaged users so system owners can intervene before adoption drops further or productivity is affected.
All dashboards can be filtered, drilled down to different sub organizations or roles, and exported as detailed reports, making it easy to share insights with leadership, training teams, or partner managers.
Get the transparency you need to improve CPQ user adoption
Tacton makes your CPQ data readily available without the need to navigate complex BI tools or data lakes. With Tacton Insights & Analytics, your data is accessible directly within your Tacton CPQ.
Behavior & Engagement Analytics is the first step in Tacton’s new Insights & Analytics portfolio, which provides different analytics use cases as part of add-ons to your Tacton platform solutions. All Tacton users will receive Behavior & Engagement Analytics complementary as part of their solution, with additional analytics use cases available as optional extensions.
Learn more about the Insights & Analytics roadmap.