Mastering Mass Customization: Best Practices for Increasing Configure-to-Order Coverage
A practical roadmap for shifting from 100% engineer-to-order to increased configure-to-order manufacturing, reducing complexity and scaling sales with better margin.

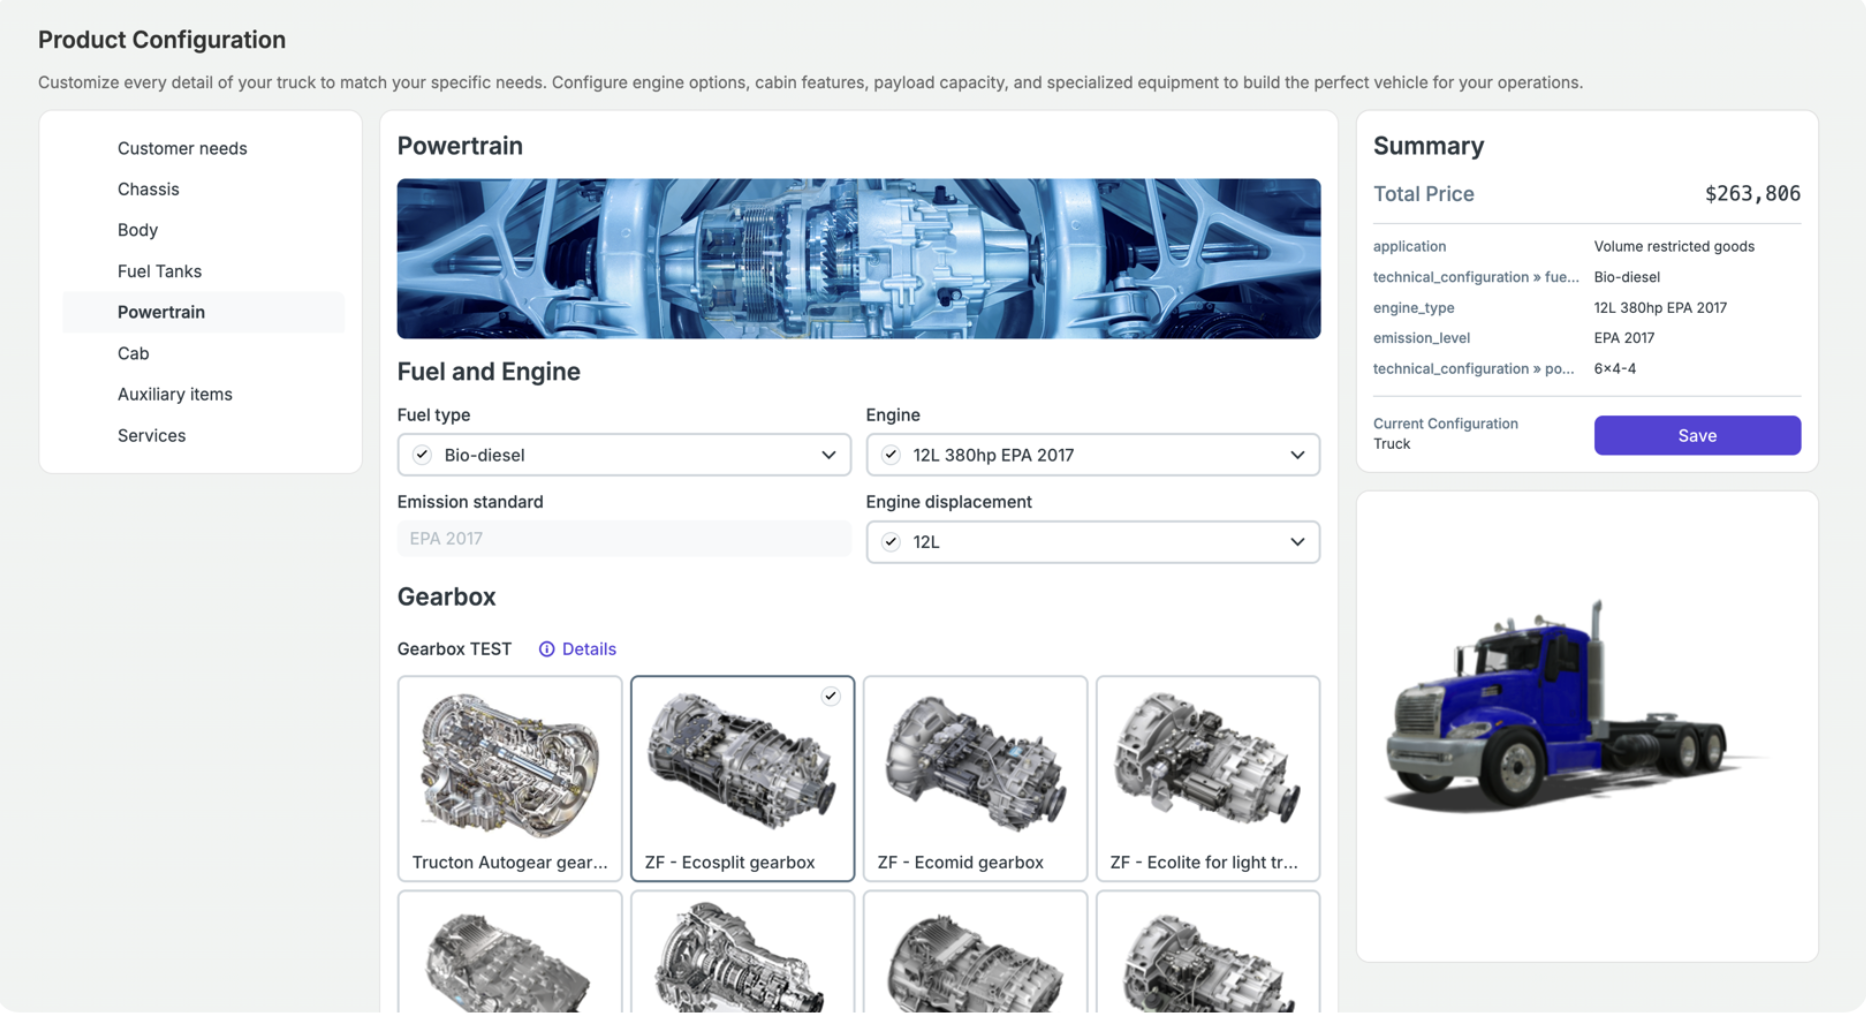
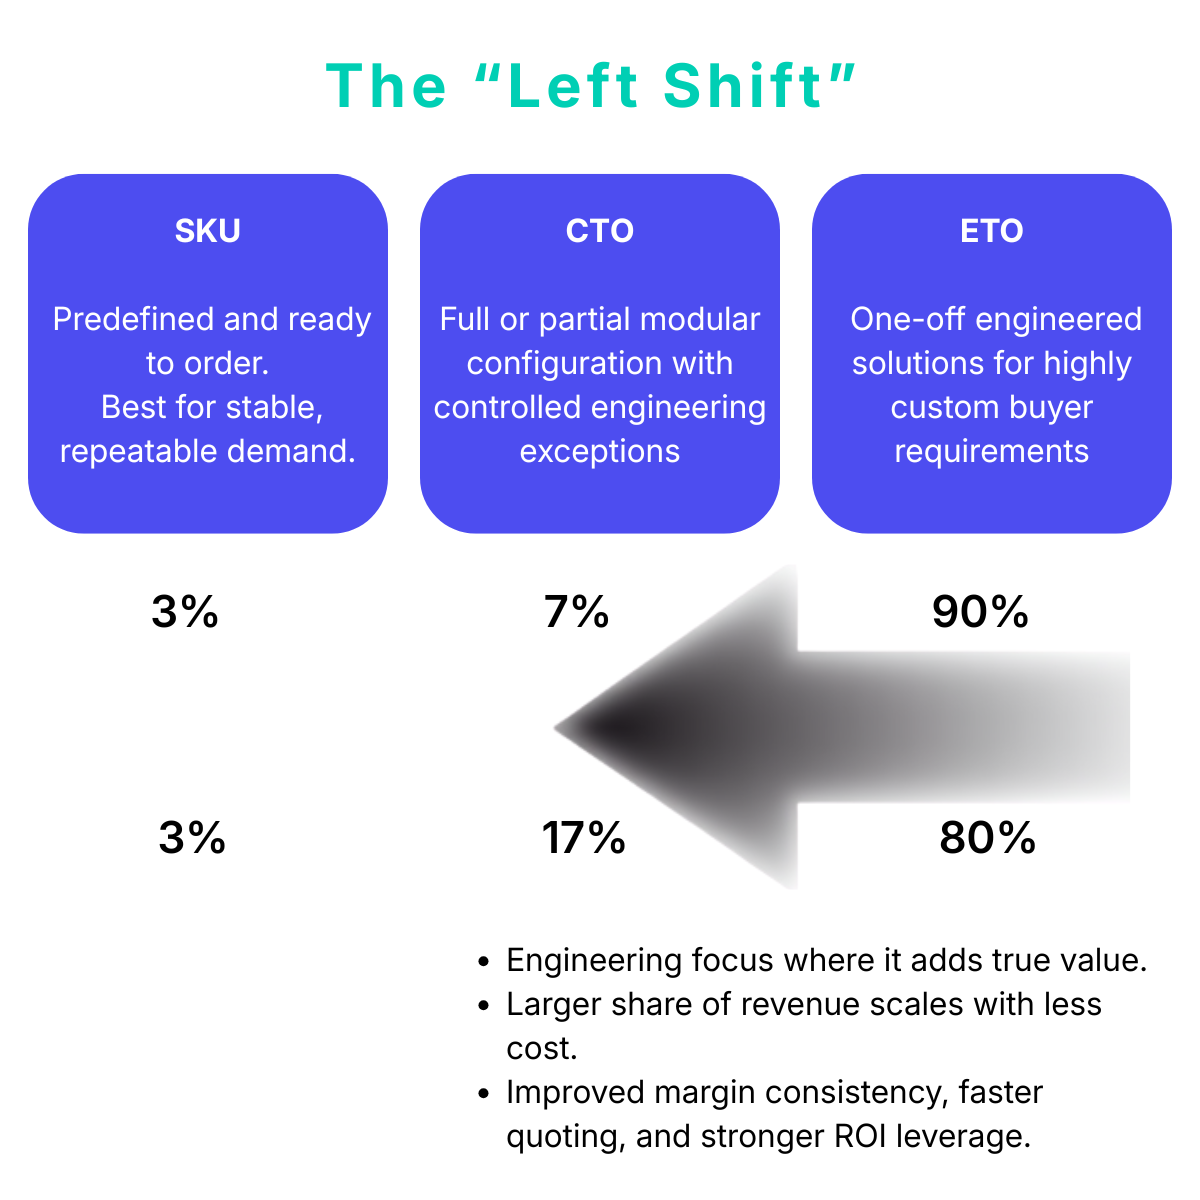
Transitioning from engineer-to-order (ETO) to configure-to-order (CTO) means standardizing repeatable configurations, so you can scale sales without overwhelming engineering. It’s not about eliminating customization but shifting toward mass customization with a more balanced hybrid model that reduces bottlenecks while preserving flexibility.
Done well, increasing CTO leads to faster quoting, fewer errors, stronger margins, and growth that isn’t limited by headcount. This roadmap outlines the key steps and common pitfalls to help you make that shift successfully.
What does an ETO to CTO transition actually mean?
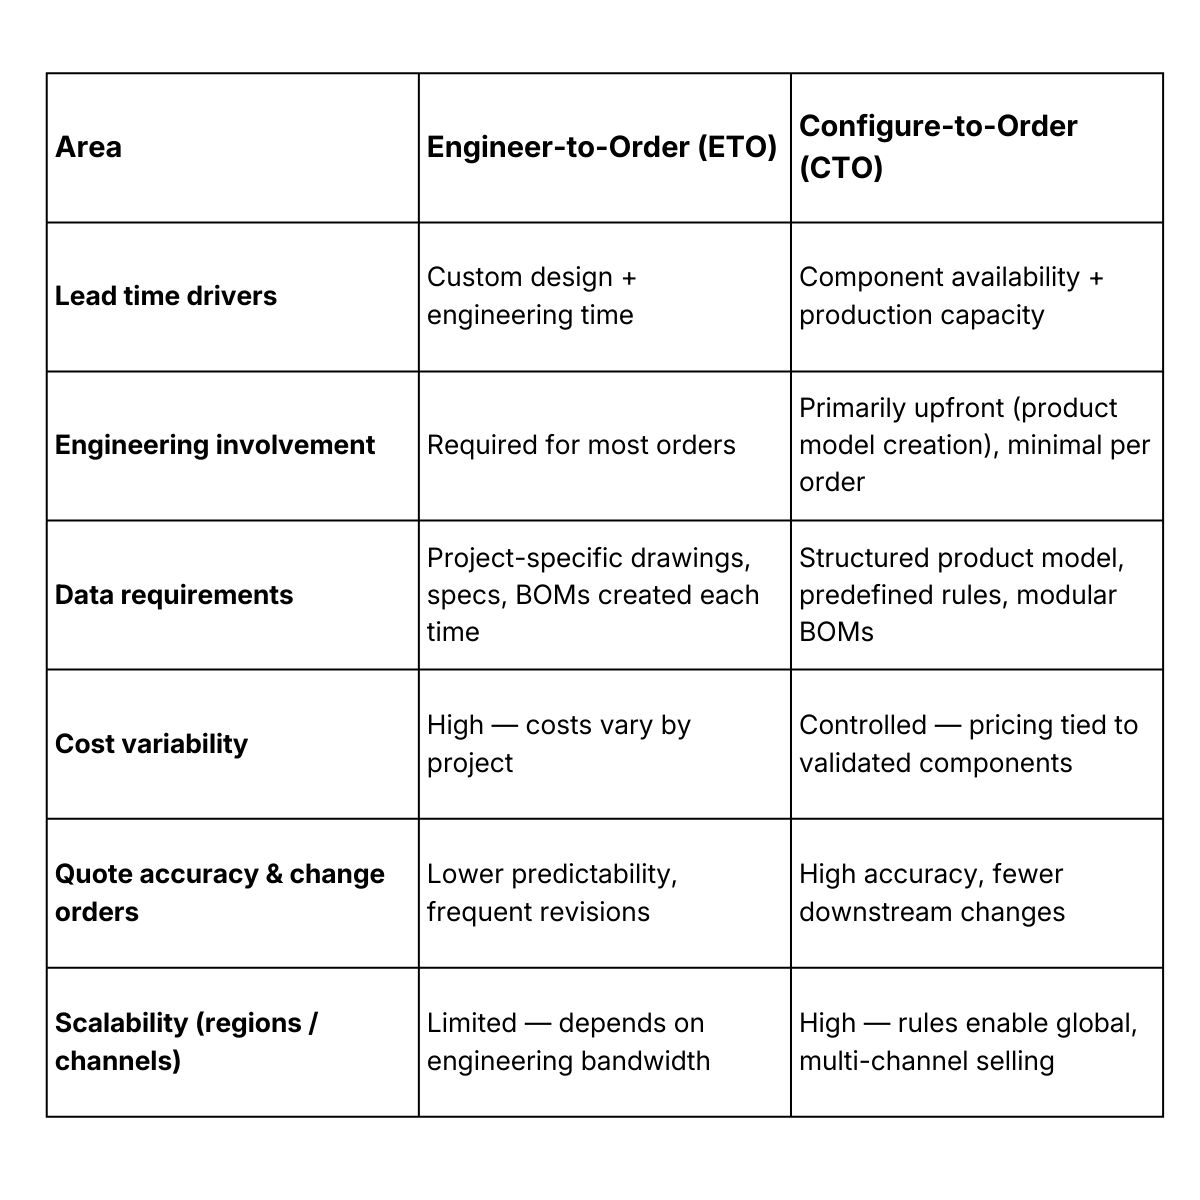
ETO manufacturing models are defined by complete customization, where no components are standard. CTO manufacturing models use standardized modules that can be combined to create flexible, yet validated solutions that don’t require heavy engineering and design support.
Many manufacturers operate in a hybrid model, but increasing CTO adoption is a goal for companies that are tasked with increasing sales without increasing engineering headcount.
Why manufacturers are increasing CTO coverage
Greater CTO coverage means more control over your sales and production functions. When you have modular products whose configurations can be constrained by automated, validated engineering rules, you open the door to multiple opportunities.
- Shorter quote cycles and competitive response times with fewer engineering bottlenecks.
- More time for engineering teams to handle exceptional projects and high-value innovation.
- Scalable sales that don’t require excessive product knowledge across your sales teams.
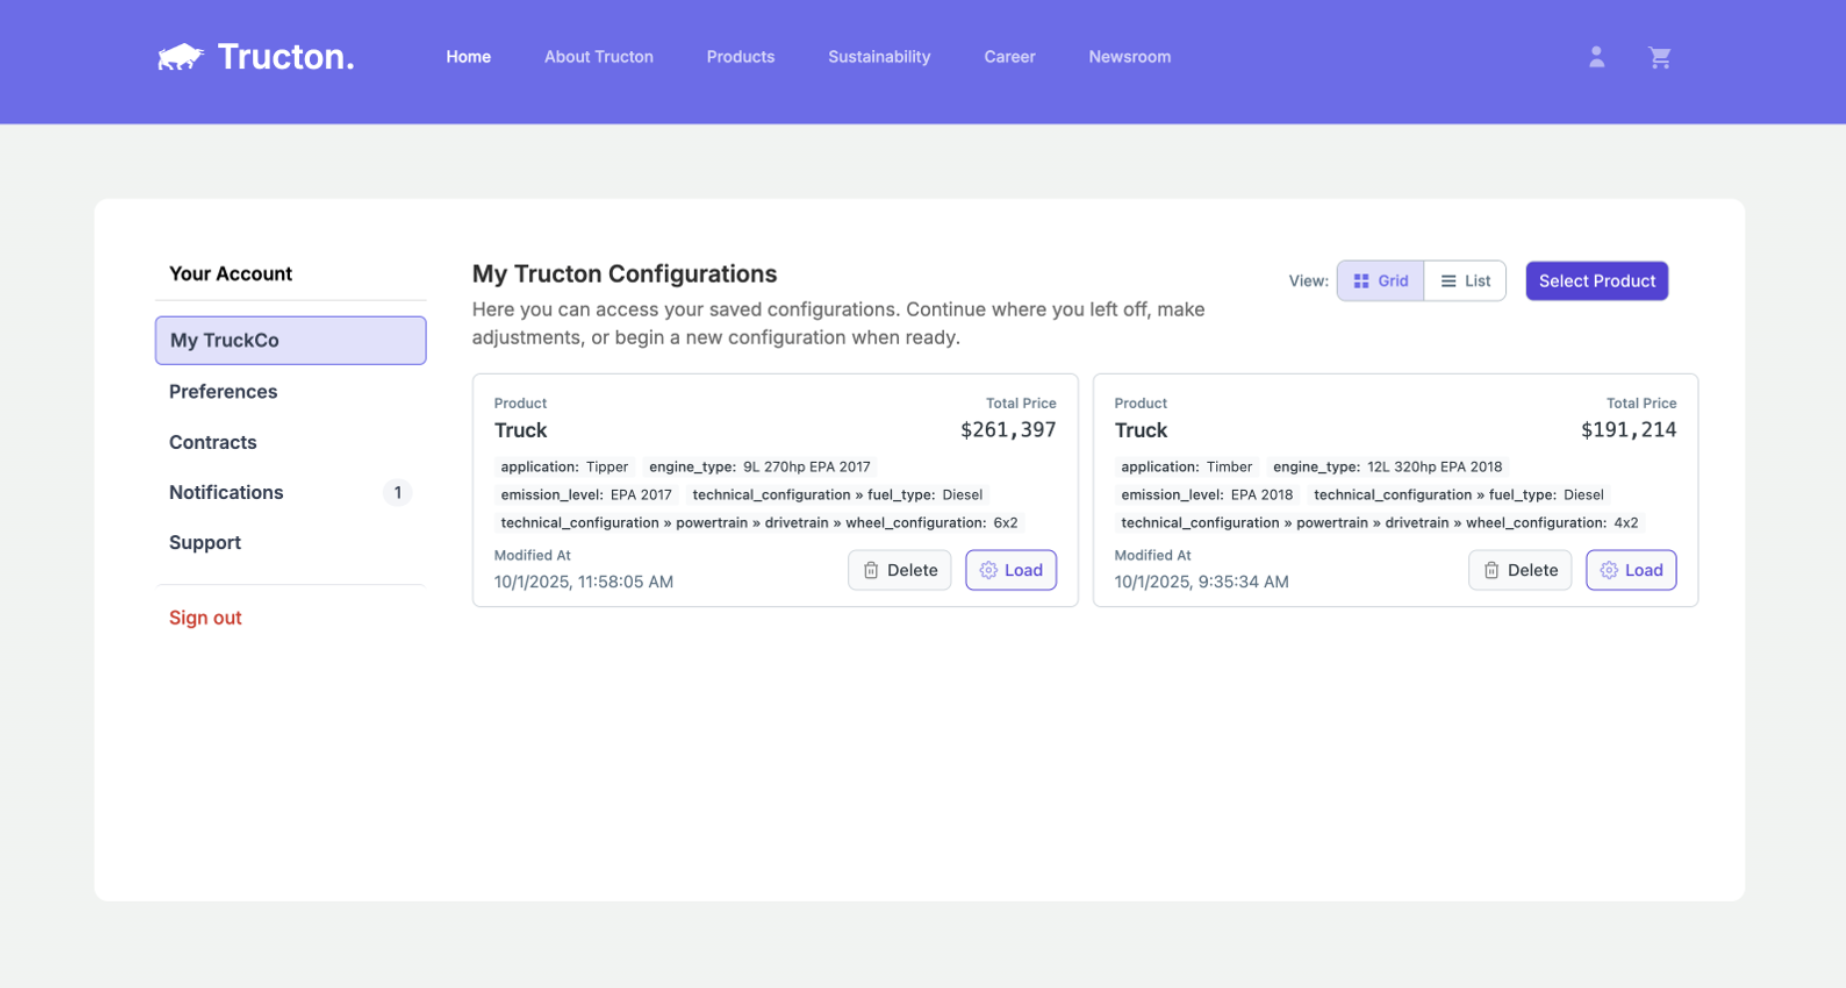
- The ability to expand sales channels to include ecommerce or self-service buying where customers can configure valid, standardized components independently.
- Fewer surprises and rework downstream, resulting in less margin erosion.
Step-by-step implementation roadmap for moving from ETO to more CTO
Fundamental transitions like these should happen in phases to reduce risk and ease your organization into the new process. These implementation steps for CTO manufacturing help you transition without major disruption to your business.
Before taking on this project, create your business case: Answer the following questions:
- How many hours are spent on non-winning quotes?
- What percentage of quotes require engineering input?
- What’s the average engineering time per quote?
- What’s the conversion rate of ETO quotes?
Phase 1: Assessment and readiness
Identify your high-volume product families. Define repeatable configurations from true, custom work, and look at the products that have the most quoting effort or engineering involvement to alleviate some of that burden. Use configuration-level quote data to identify which components, options, and combinations are repeatedly configured and ordered. Patterns often reveal that more is repeatable than teams believe.
Then, evaluate PLM, ERP, and pricing data quality. Is there integration complexity that makes it difficult for teams across regions to work from the same data or configuration logic? Document inconsistencies and ownership gaps.
Finally, define your business objectives. What is your target quote turnaround time? What is an acceptable CTO/ETO split? Metrics like margin, win rate, or even tool adoption will best measure the success of increasing CTO coverage.
Phase 2: Pilot and modeling
Don’t move all at once. Begin with a single product line that your organization feels will have the highest business impact. Choose a product line with moderate complexity first, strong internal ownership, and good data availability. Cleaning up data and product values is crucial for the next step: product modeling.
When modeling in CPQ, translate engineering logic into rules or constraints. Define valid combinations and dependencies. Embed pricing logic. Maintain controlled exception pathways or alerts when a configuration requires an engineering override or an ETO exception.
In addition, approvals (e.g., discount approvals or business approvals) and margin governance should be built into your quoting tool for the best line of control.
Phase 3: Integration and commercial alignment
Your team can’t scale sales if they’re working from different data and systems. Configuration logic should be your single source of truth across the organization, with strong integration between PLM (product data), ERP (pricing, orders), CRM (opportunities), and CPQ (quoting).
Phase 4: Change management and adoption
One of the biggest obstacles to increasing CTO coverage is objection from internal stakeholders—especially engineering teams.
Position CTO as scaling expertise rather than replacing it. Provide communication early in the process by explaining the business reasons and value of a hybrid manufacturing model. Create champions within your teams and bring engineering and sales into the transition process to own new processes, product logic, and workflows.
Structured training is key. Phasing your transition also reduces disruption to your business and proves value one product, region, or channel at a time, so your internal success stories fuel further buy-in.
Phase 5: Formalize the “exception to standard” conversion loop
Continue to track repeated ETO requests. After X occurrences, evaluate for potential CTO inclusion and assign ownership for rule addition and portfolio documentation.
What modular CTO and mass customization looks like at scale
For many manufacturers, the objective of increasing CTO coverage is to reduce engineering bottlenecks, shorten quote cycles, expand sales channels, and create tighter control across systems. Piab’s experience illustrates what that looks like when modular design is structured for scale.
Piab, a global manufacturer of vacuum automation and lifting solutions, already established a modular manufacturing model and wanted to scale. By centralizing and standardizing its modular logic within an integrated CPQ connected to ERP, pricing, and documentation, Piab turned product flexibility into scalable commercial capability across its company with great results:
- 40,000+ monthly self-service configurations, enabling customers and partners to generate validated solutions independently.
- 58,000+ configured ERP items, converting repeatable configurations into modular order components.
- 6,000+ automatically generated documents per month, accelerating validation and reducing manual engineering effort.
The 10 most common mistakes in expanding CTO coverage
Avoid these common pitfalls when shifting from ETO to CTO:
1. Automating a broken quoting process
Digitizing an unclear or inconsistent ETO workflow only scales inefficiency. Redesign poorly governed approvals, exception handling, ERP consistencies, or sales–engineering collaboration before automating.
2. Trying to standardize 100% of products
Eliminating ETO entirely creates resistance and removes strategic differentiation. Structure exceptions with controlled approvals instead of eliminating them.
Build approved alternatives into your configuration logic so flexibility doesn’t require full engineering involvement. For example, allow pre-approved component or control system brands (e.g., ABB vs. Siemens) within defined rules rather than triggering custom design.
3. Skipping product modularization
“Our product structures are not mature enough.”
If platforms, options, and dependencies aren’t clearly defined, rule complexity explodes. Clean up product architecture before modeling configuration logic.
4. Underestimating data preparation
Poor product, pricing, or ERP data delays modeling, complicates system maintenance, and erodes trust. Define governance and ownership early.
5. Failing to define rule ownership
Eventually, configuration rules become outdated, and without ownership, teams blame each other and sales bypasses the system completely.
Assign responsibility for rule maintenance, pricing logic, and lifecycle updates.
6. Ignoring exception governance
Unchecked overrides and manual workarounds quickly erode margins. Define escalation workflows and convert repeated exceptions into standard options.
7. Scaling before stabilizing
Expanding across regions or systems too quickly multiplies inconsistencies. Prove and stabilize one product line before scaling.
8. Underestimating integration complexity
PLM, ERP, CRM, and CPQ alignment is foundational. Scope integrations deliberately. Don’t assume they’ll “work themselves out.”
9. Treating CTO as an IT project
This is a commercial transformation. Executive sponsorship and cross-functional alignment are critical.
10. Measuring adoption instead of business impact
Go-live date is not the impact metric. Track engineering hours saved, quote turnaround time, margin performance, and CTO/ETO ratio over time.
Move from reactive engineering to scalable configuration
Scaling modular CTO requires structured configuration logic, integrated systems, and governance that supports growth over time. It also requires visibility.
Tacton CPQ helps manufacturers not only translate complex product architecture into scalable, constraint-based configuration, but also analyze configuration-level quote data to identify repeatable patterns, recurring exceptions, and components that are strong candidates for CTO expansion.
See how we help manufacturers increase CTO coverage strategically.
Frequently asked questions about CTO
Is expanding CTO coverage right for everyone? These questions or objections may sound familiar.
Q: Can we move to CTO with highly complex products?
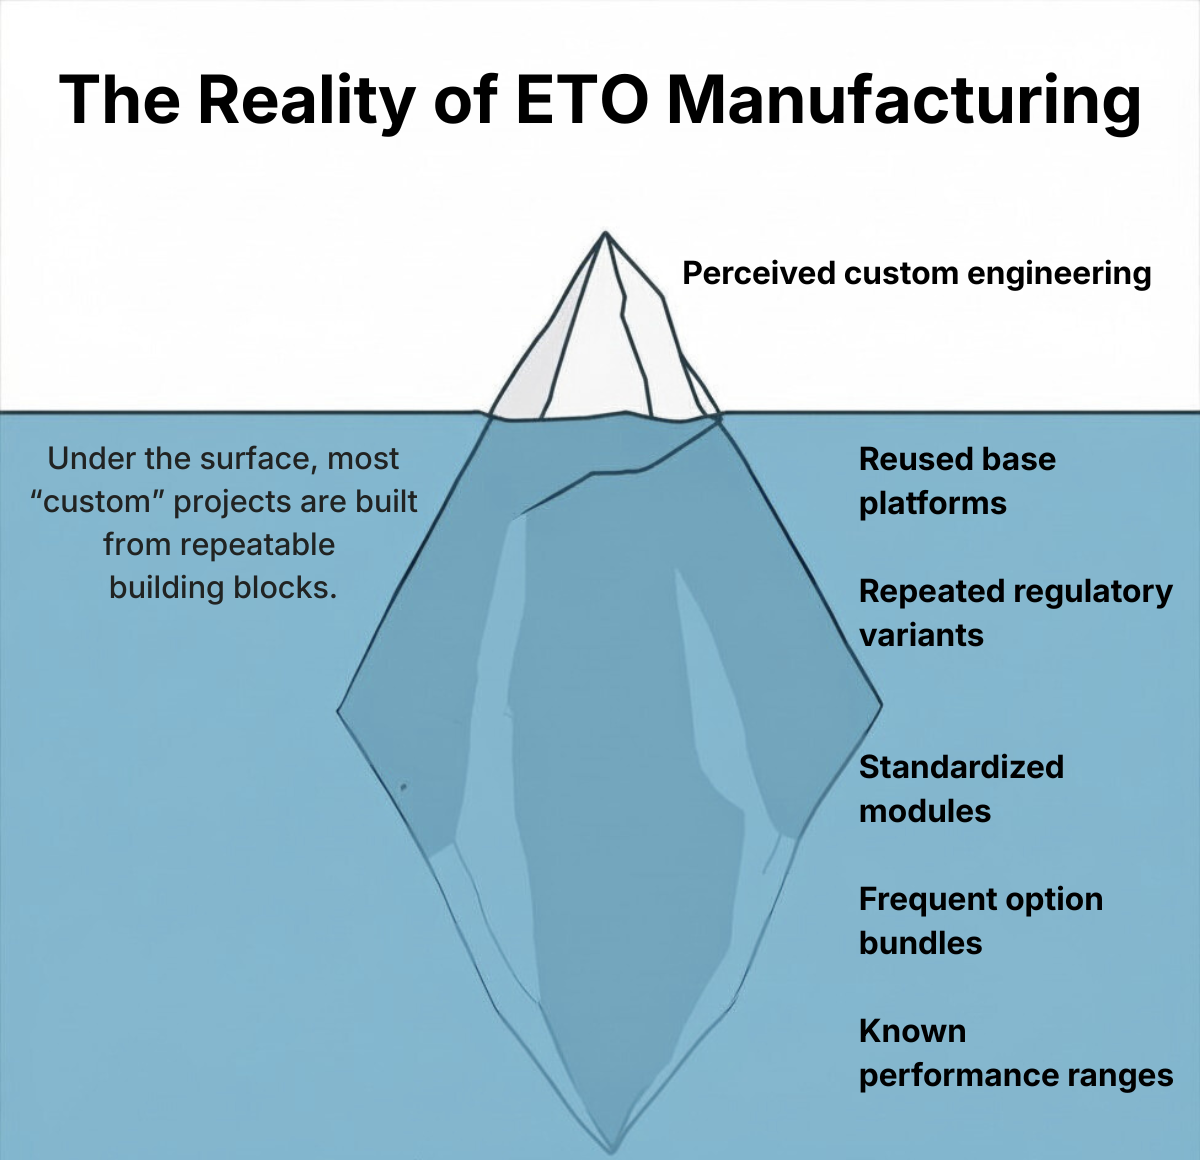
If you manufacture highly configurable products, your pride yourself in the complexity and uniqueness of your product. But complexity does not eliminate all repeatable patterns.
Repeatable configurations are always possible, and regulatory and performance variations can often be modularized.
Q: Will moving to CTO reduce our ability to handle custom requirements?
Entirely ETO or CTO manufacturing models are unsustainable. A hybrid CTO-ETO model that uses controlled escalations for true edge cases is the best model for complex manufacturers. CTO handles volume, while ETO handles differentiation.
Q: How long does an ETO to CTO transition take?
The transition requires standardized configuration logic to be digitized in a quoting tool, such as CPQ. That implementation can be longer for homegrown tools or as little as four to six months for a purpose-built CPQ software.
However, the full transition could take much longer, depending on how many products are piloted and how much of the portfolio is phased in over that journey.
Q: What resources are required?
Besides quoting tools to scale and streamline sales, your greatest resource is people. The following stakeholders are essential for making the transition from ETO to CTO manufacturing.
- Business process owner(s)
- Product modeling experts
- Sales and engineering key users
- Integration and IT support
- Executive sponsorship
Q: What ROI can we expect?
By streamlining sales and quote validation, you can reduce quoting time from weeks to hours, with additional margin uplift through pricing control and reduced order errors or rework.
Faster response times also yield higher win rates against slower competitors.