Back to Resources

What Is Configuration-Level Analytics? What It Can Tell Each Team in Your Business

See how configuration data reveals the why behind business outcomes across sales, product, finance, and operations.

Share:

What Is Configuration-Level Analytics? What It Can Tell Each Team in Your Business

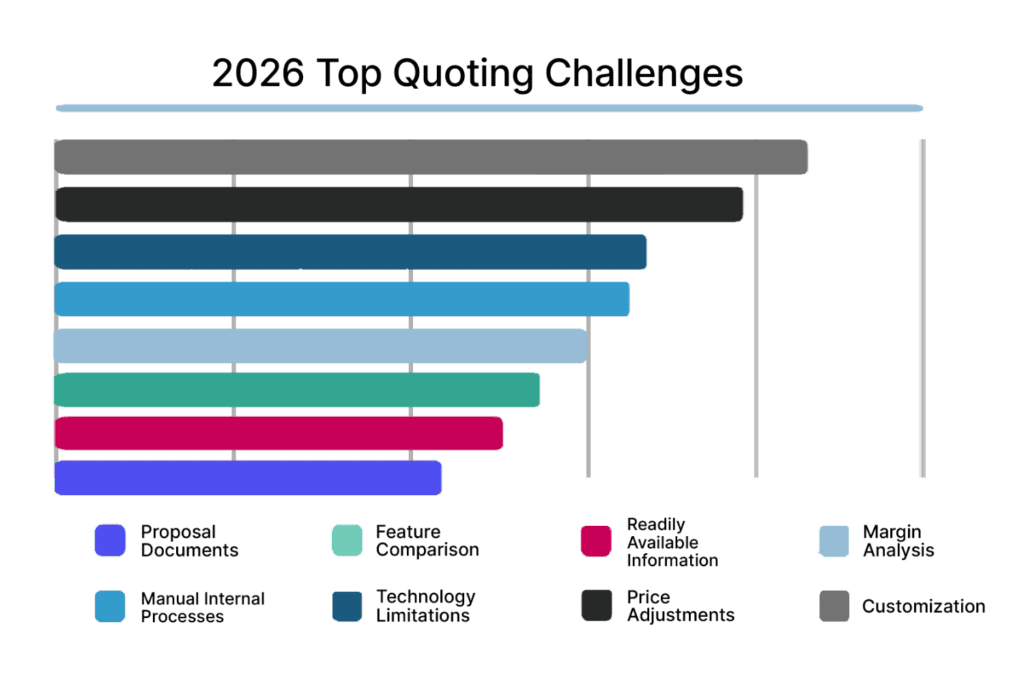
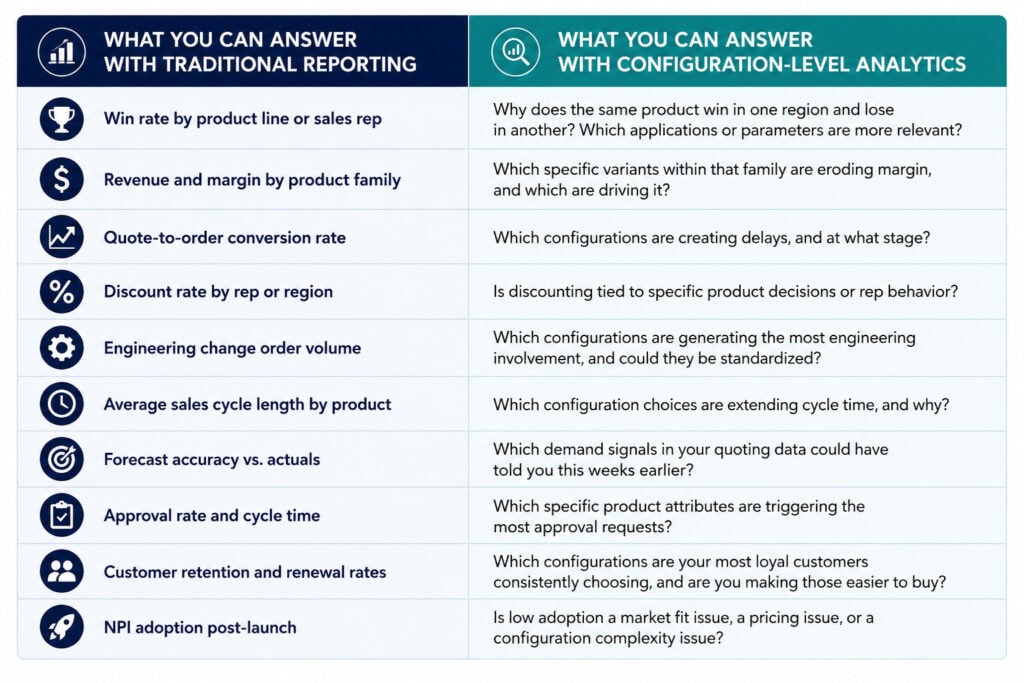
Manufacturers are good at reporting on what happened. You may already run detailed commercial analytics: win rates by product line, discount rates by rep and region, quote-to-order conversion, sales cycle length by product category, engineering change order volume, number of approvals, NPI adoption after launch.  

These are the reports that mature commercial and finance teams rely on, and they’re genuinely useful. However, they all share similar blind spots. They tell you what happened, but not the context and decisions behind why. If you have a longer sales cycle with complex quoting processes, the why almost always starts with a decision made during configuration and quoting. 

What is configuration awareness? 

Configuration awareness is the ability to capture and retain the full context of every configuration decision made during the quoting process, rather than just the final order.  

That includes: 

  • Which options a customer selected, adjusted, or removed 
  • Which configurations required engineering approval or override 
  • Which combinations were explored but ultimately abandoned 
  • How a solution evolved across multiple quote iterations 


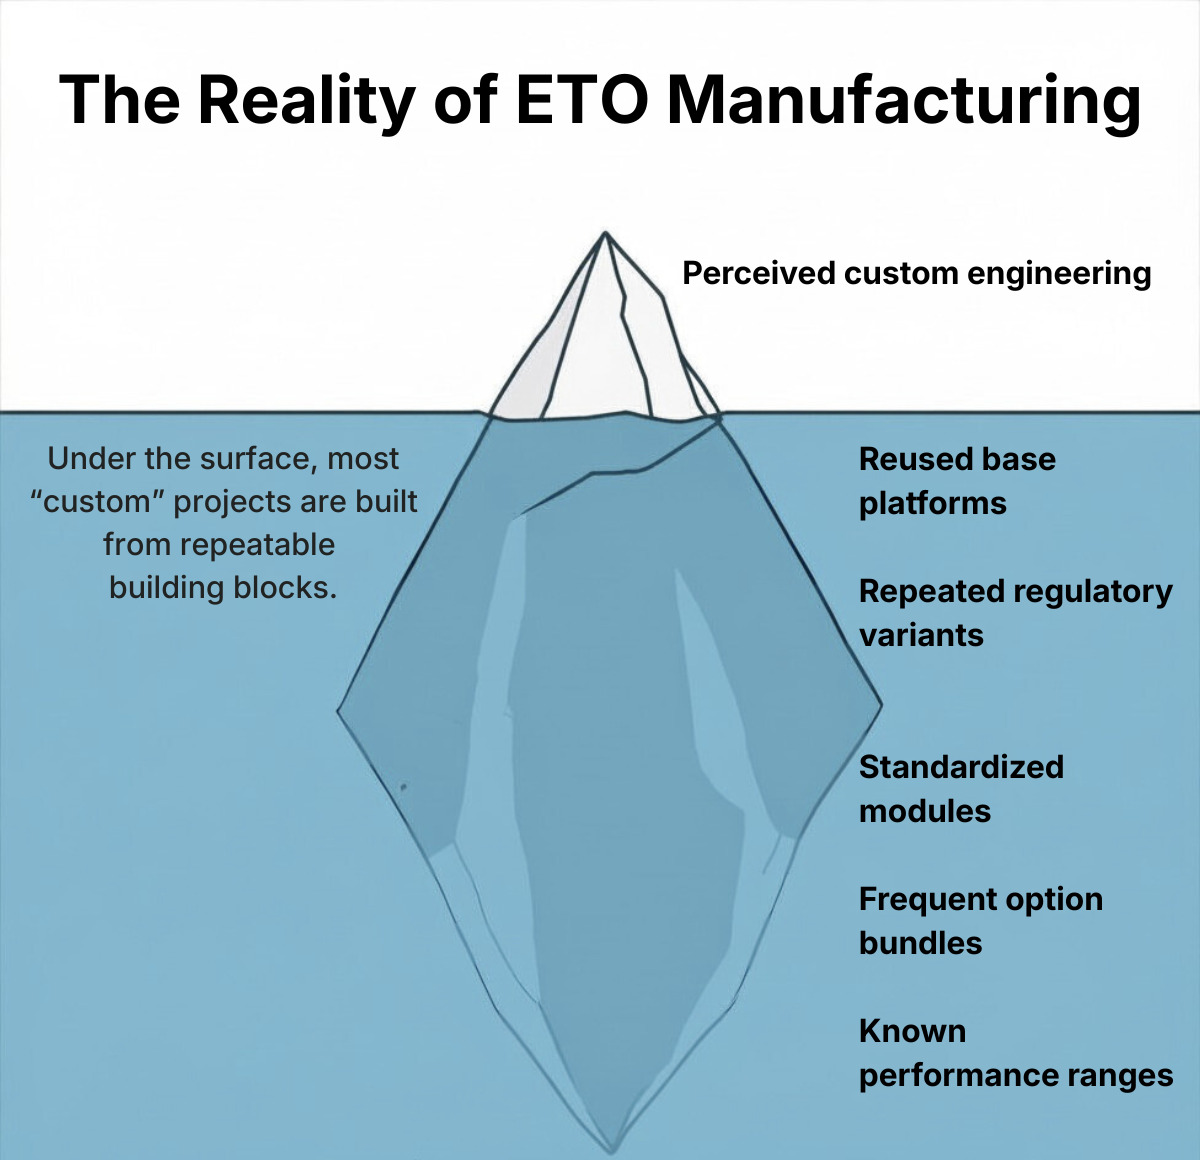
When selling highly configurable products (e.g., high-mix industrial machinery, engineer-to-order systems, configure-to-order equipment with complex dependencies), this context is generated every time a quote is built. Most businesses generate it. Very few can see it.  

What is configuration intelligence? 

Configuration intelligence is what happens when that configuration data is connected to business outcomes (e.g., win rates, margin, product performance, demand patterns) and made available for analysis. 

Where configuration awareness is about capturing context, configuration intelligence is about using it to answer the questions that drive commercial performance:  

  • Why do certain configurations win in some markets but not others? 
  • Which product variants are generating margin, and which are eroding it? 
  • What demand is building before orders arrive? 
  • Where is complexity slowing down your sales cycle? 


The difference between the questions you can answer now and the questions you can answer with configuration data give you a deeper understanding of how to change business outcomes for the future.  

Traditional reporting versus sales configuration analytics for manufacturing

How do you get configuration-level data? 

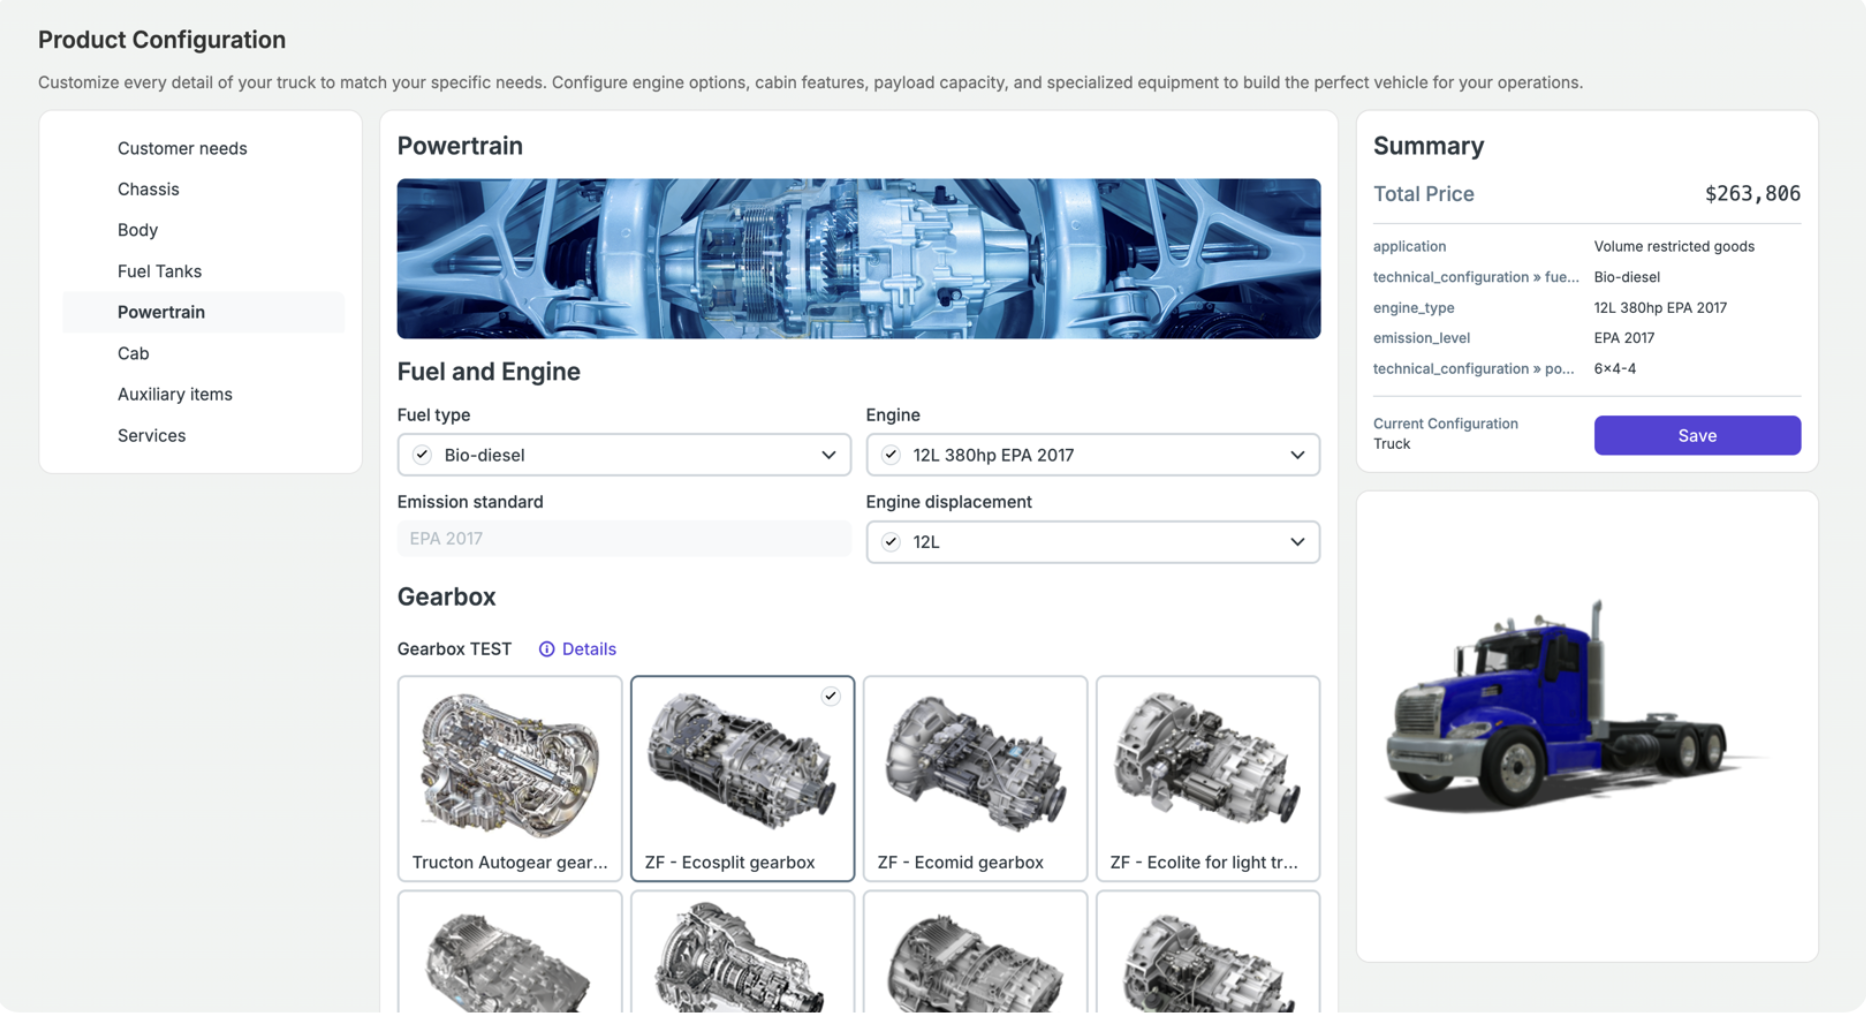
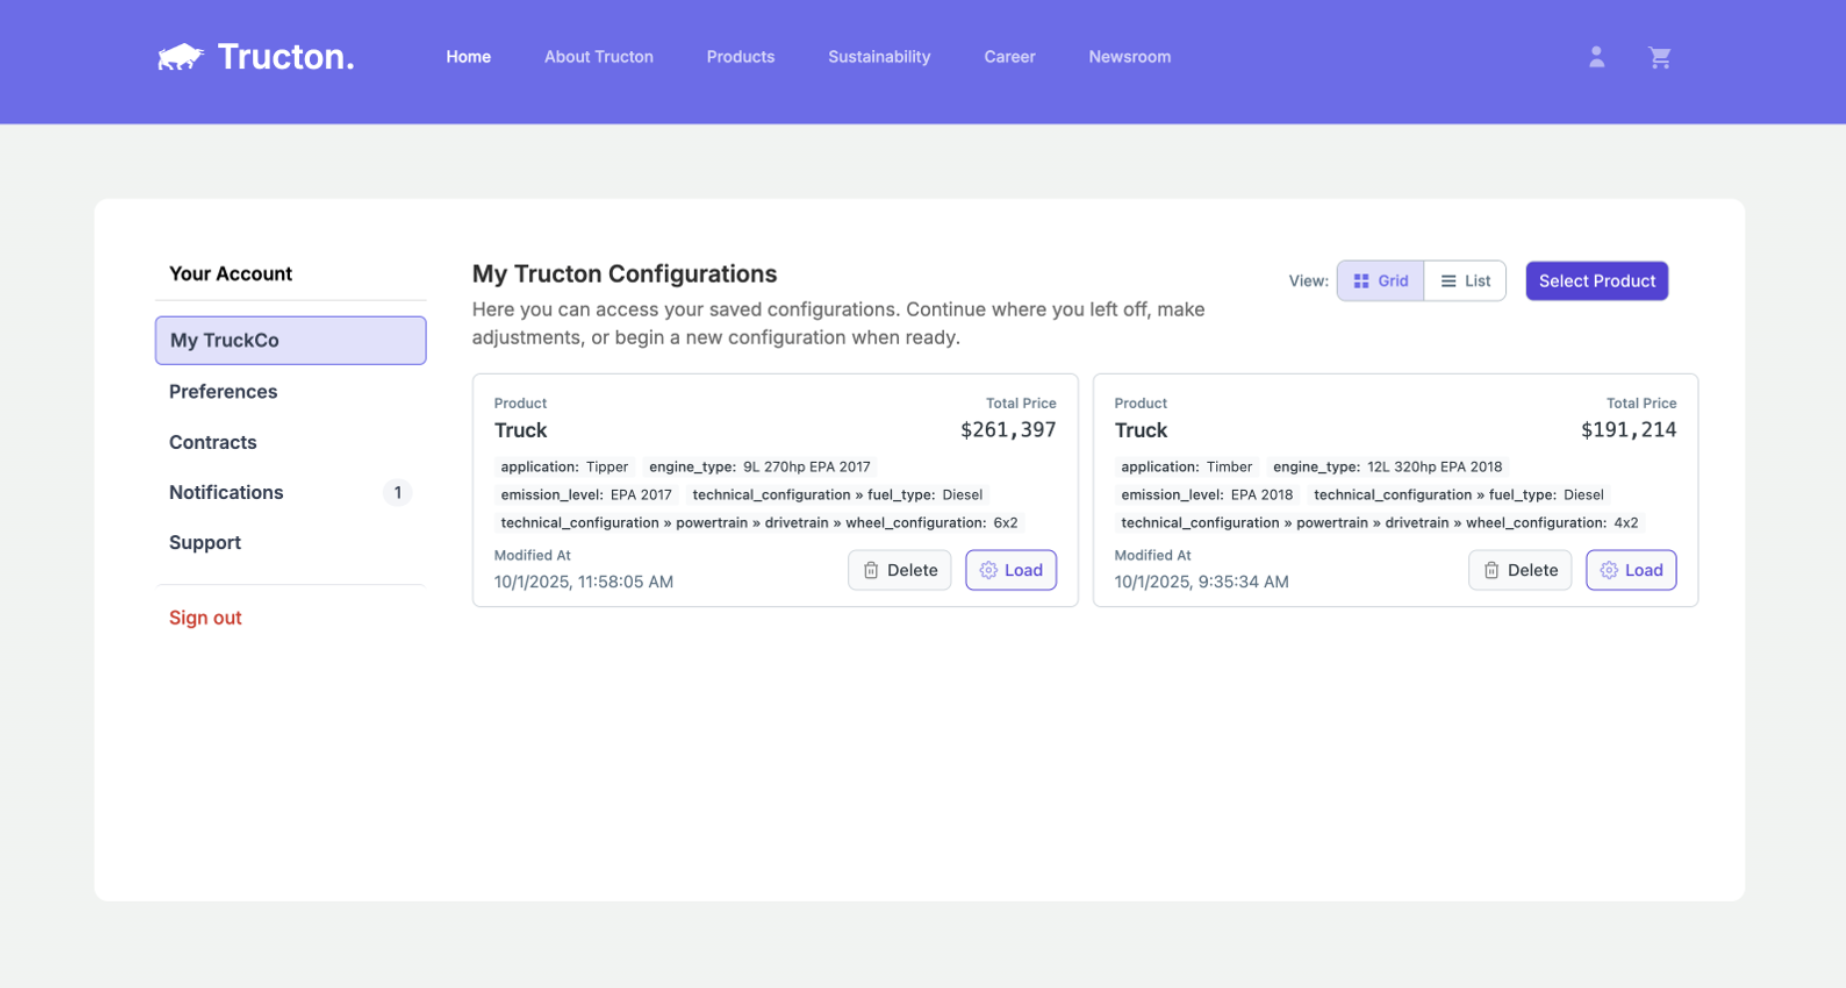
Configuration intelligence requires a CPQ platform that is purpose-built to model complex, configurable products. Manufacturers can use data contextualized by CPQ, such as configuration parameters and pricing logic, to capture not just what was quoted, but the full decision context behind it. 

Generic CPQ platforms built for transaction management flatten or lose that context before it can be analyzed. Manufacturers with high product complexity, deep configuration logic, and engineer-to-order or configure-to-order sales motions need a CPQ foundation that holds that context natively, with an embedded analytics layer built on top of it. 

How each team in the manufacturing lifecycle can use configuration  data 

The questions configuration intelligence can answer look different depending on who’s asking. Here’s what it unlocks across the manufacturing business. 

Sales and commercial teams: understand what actually wins 

Your goal as a sales leader is to achieve consistent commercial performance and win rates across regions, rep teams, and market segments. 

Your teams know that winning often comes down to which configuration was recommended and how it fit the prospect’s business goals, not just how well a rep managed the relationship. Configuration data makes the patterns behind those wins explicit and replicable. 

By cross-referencing product attributes with industry, application, and geography, teams can see that a specific motor configuration, for example, consistently wins in industrial applications but underperforms in commercial ones — or that a feature set that converts in North America struggles in Europe.


That analysis translates directly into commercial performance:

  • Which configurations drive the strongest win rates by market or segment
  • Where long sales cycles or high discount rates are tied to specific product decisions
  • Which premium configurations convert quickly versus which ones stall
  • How product mix connects to revenue outcomes across the team


Product and engineering: build an efficient portfolio that performs 

Your goal is to develop a product portfolio that is profitable, manageable, and aligned to what customers actually want. 

In high-mix manufacturing, individual variants within a product family can quietly drag on margin, create engineering overhead, or contribute to lost deals, while the family looks successful in aggregate. Configuration data provides the granular visibility needed to refine your portfolio based on customer buying behavior. 

Imagine that a product family generating strong revenue overall may contain specific options that are rarely selected, consistently appear in lost deals, or trigger repeated engineering involvement. Configuration data surfaces those patterns and shows where recurring custom requests point toward gaps in the standard portfolio. 

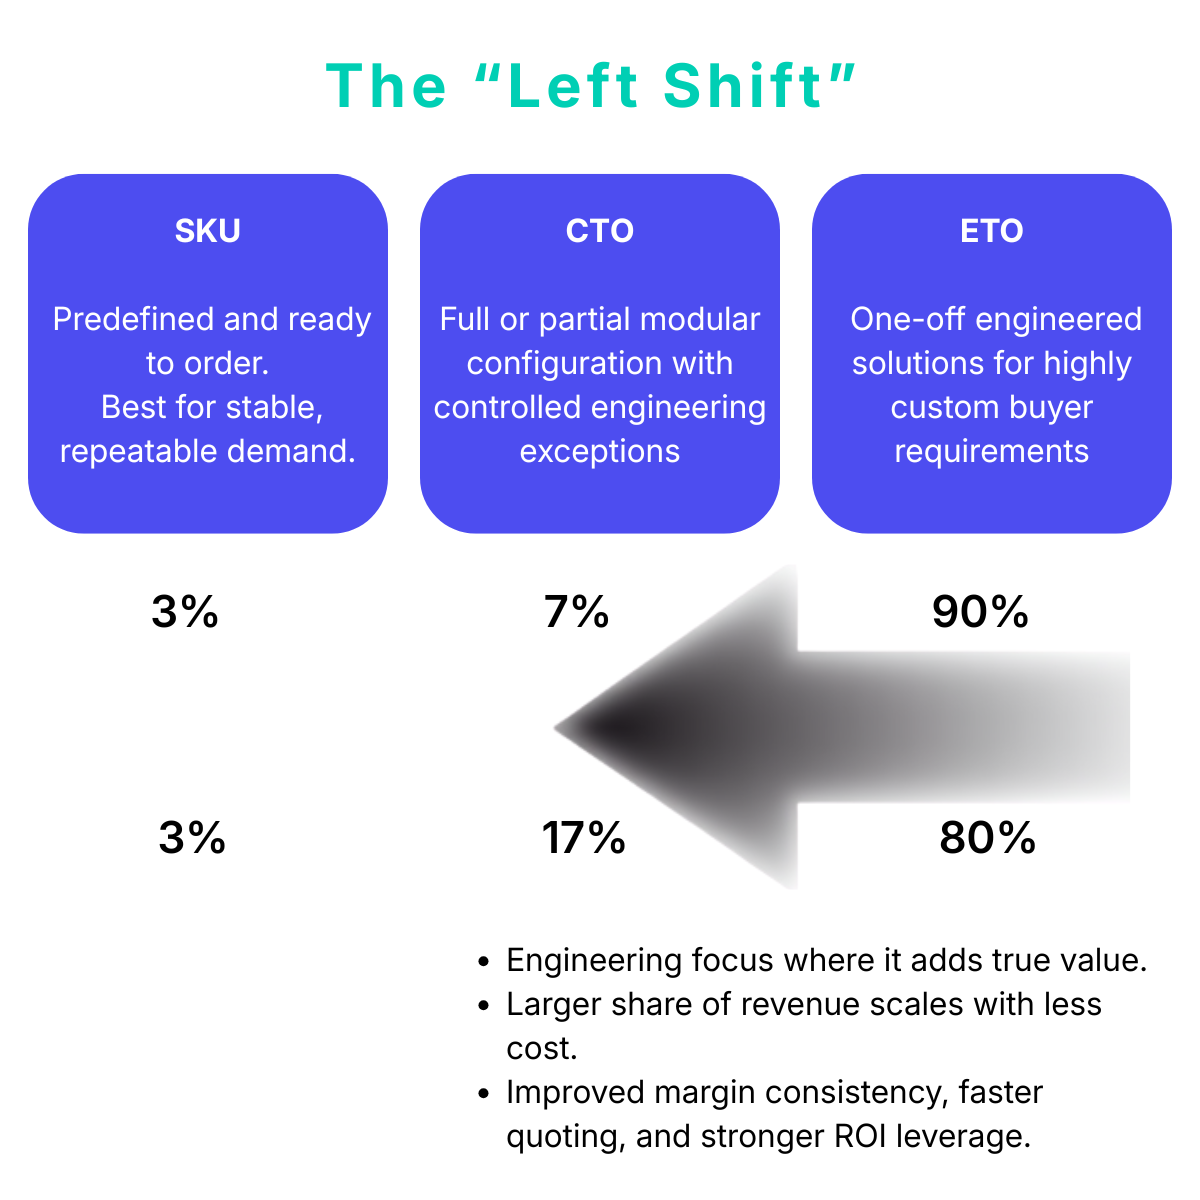
Configuration data also enables direct measurement of CTO and standardization progress, something order data and approval counts can’t do alone. If customers repeatedly request the same customization, that’s a signal to create a standard module.

If certain configurations consistently trigger approvals or extend sales cycles, they’re candidates for redesign or retirement. 


Across both decisions, configuration data makes it possible to:


C-suite and finance executives: connect configuration decisions to margin 

Profitable growth is created by understanding not just where revenue is coming from, but where margin is being made or eroded.  

Two deals can look identical on the revenue line while having very different profitability profiles. One closed cleanly. The other looped through approvals, pulled in engineering, and was discounted twice. That difference started during quoting — and standard financial reporting can’t see it.  

Imagine that configuration data from your company’s CPQ activity. It shows which specific product attributes and variants are associated with high discount rates, engineering involvement, or extended approval cycles, therefore connecting those behaviors directly to margin outcomes before they accumulate on the P&L. 


For commercial, operational, and finance teams, that means:

  • Identifying which configurations drive profitable growth vs. erode margin
  • Understanding the relationship between product decisions, discount behavior, and deal profitability
  • Informing pricing strategy with configuration-level performance data
  • Catching margin erosion at the configuration level, not the P&L level

Operations and supply chain: plan around what customers actually  build 

Production and inventory planning should anticipate early demand and emerging buyer behavior rather than simple order history. 

For operations teams in complex manufacturing, order data is a lagging indicator. Configuration data, or how configuration decisions across the sales cycle, moves the signal earlier and at a more useful level of detail. 

Take, for example, which motors, controls, accessories, and service options customers consistently select alongside a given machine. Which combinations are gaining frequency in quotes months before they show up in orders. Where component-level demand is quietly building.


That earlier visibility changes what’s possible in planning:

  • Anticipate component-level demand based on configuration patterns, not just order history
  • Plan inventory around complete solution configurations, not individual SKUs
  • Reduce the gap between demand signal and production response
  • Build forecasting models that reflect how customers actually configure


Improve commercial performance with your configuration data  

Each function is asking different questions, but they share the same underlying problem. The most valuable signals about customer intent, product performance, and commercial outcomes are generated during the configuration and quoting process, and most manufacturing businesses have never had a structured way to see them. 

Configuration intelligence allows your teams across the business to connect the context that already exists inside your quoting process to the business outcomes each team is responsible for. When that connection is made, the questions that used to take weeks to answer, or simply went unanswered, become part of how every team operates. 

Portfolio Performance Intelligence is built natively into Tacton CPQ, giving product, sales, commercial, and operations teams direct access to configuration-level insights  without additional tools, data exports, or IT requests.  

Learn More

Back to Resources

The Missing Demand Signals for Improving Supply Chain Forecasting and Production Planning

Get insights into customer demand before orders are made by using CPQ and configuration-level analytics.

Share:

The Missing Demand Signals for Improving Supply Chain Forecasting and Production Planning

Visibility is the foundation of effective demand forecasting and production planning. Manufacturers can only plan for the demand they can see, and supply chain and production teams often lack early insight into the specific configurations, features, and option combinations customers are requesting. Without that level of visibility, supply chain teams may miss emerging demand patterns, inventory risks, and component dependencies that directly impact service levels and profitability. 

Currently, 50% of manufacturers report that they’re able to track demand forecasting and inventory planning. However, only 45% track configuration decisions made before the order, and 30% or less track feature and option demand or the most or least quoted configurations. It’s an overlooked layer of data that can increase efficiency much earlier for high-mix, low-volume production.  

The limits of traditional forecasting models 

Traditional demand forecasting and production planning looks to historical orders to understand future demand. While it’s a reliable source of information, it only provides information after the order is made, rather than emerging demand trends that can improve lead times and margin.  

How can supply chains forecast demand for configurable products? 

Highly configurable products make production planning even more challenging. Supply chain and operations leaders must account for thousands or millions of possible combinations, constant changes in customer requirements, and regional and customer-specific preferences against a growing portfolio.  

Supply chains forecast demand for configurable products most effectively when they combine historical order data with configuration, quote, and feature-level demand signals. 

Quote activity helps supply chain teams identify growing feature demand and potential component constraints weeks or months before those changes appear in order history or a manufacturing Bill of Materials. 

Configuration-level insight helps answer: 

  • Which options are appearing more frequently in quotes?  
  • Which premium configurations are gaining traction but haven’t yet converted to orders?  
  • Which feature combinations are being evaluated by customers?  
  • Which regional preferences are emerging?  
  • Which products are being configured but abandoned?  
  • Which new product variants are generating interest? 
  • Which product variants are increasingly bought or combined together? 


Those insights can significantly improve forecasting, inventory planning, supplier collaboration, and production scheduling. 

Why configuration decisions matter for supply chain leaders 

Imagine you’re selling commercial HVAC systems. 

Your forecast accurately predicts demand for 1,000 units next quarter. Inventory levels are healthy, and procurement has ordered components based on historical demand patterns. Yet production delays begin to increase. 

Looking at order volumes alone, demand appears stable. But configuration-level analysis reveals something important: 

  • Customers are increasingly pairing a premium control system with a high-efficiency compressor package.  
  • When those options are selected together, they require a specialized circuit board sourced from a supplier with a 16-week lead time.  
  • The circuit board isn’t a problem when the options are ordered separately. It becomes a bottleneck when the combination becomes more popular.  
  • Quote activity shows this combination appearing in nearly twice as many opportunities as six months ago, but supply chain teams weren’t tracking configuration trends closely enough to spot the shift.  


The manufacturer forecasted how many HVAC systems customers would buy. They didn’t understand how customer preferences were changing within those systems. They couldn’t see that six months before orders increased, the premium control system and high-efficiency compressor package began appearing together in a growing percentage of quotes. 

As a result, a single constrained component delayed production. Inventory accumulated for components associated with declining configurations. Procurement reacted after shortages appeared rather than planning ahead. Delivery commitments became harder to meet.  

How to improve demand forecasting accuracy

If you want to improve forecasting accuracy, start by looking beyond completed orders. Earlier demand signals, such as the decisions made during the sales configuration and quoting process, provide insights into customer preferences before they affect inventory, procurement, and production planning, giving teams more time to make better decisions and see potential risks.

1. Connect commercial and operational data

Improving demand forecasting starts with connecting data across the customer journey, not only in orders, but also quotes, configuration decisions, inventory, and production data. Just as the quoting process should have manufacturability embedded in configuration constraints, the quoting process should also provide downstream manufacturing teams with important quote and configuration data. This provides visibility into changing customer preferences before they affect procurement and production schedules.

2. Track demand at the configuration level

Only 27% of manufacturers can track metrics such as most quoted configurations, fastest-growing options, and feature adoption trends to identify shifts earlier. Embedded analytics that contextualize your CPQ data can show you which configurations require longer sales cycles or what is explored but doesn’t often convert. 

3. Measure business impact, not just demand

Not all demand contributes equally to profitability. Analyze which configurations generate the highest revenue, margins, and conversion rates alongside which products create the most operational complexity. This helps align supply chain investments with business outcomes. 

4. Identify emerging supply chain risks 

Look for demand patterns that could create future constraints. Which growing configurations rely on long lead-time components? Which option combinations require specialized resources? Understanding these relationships helps teams anticipate bottlenecks before they impact delivery performance.

5. Continuously refine forecasts with performance data

Demand forecasting should be an ongoing process. Regularly review metrics such as quote-to-order conversion rates, feature and option demand trends, most and least quoted configurations, and forecast accuracy. These insights help you improve planning decisions while balancing inventory, capacity, and profitability. 

Demand Forecasting for Manufacturing 4.0: From Product Forecasts to Configuration Intelligence 

Demand forecasting in manufacturing is evolving from product-level forecasting to configuration intelligence. Manufacturers that incorporate configuration, feature, option, and quote data into forecasting processes gain earlier visibility into demand shifts and can make more informed inventory, procurement, and production decisions. 

Manufacturers need configuration-level demand intelligence, because historical order data doesn’t reveal the full picture of emerging customer preferences, future component demand, or changing configuration trends. 

Learn how manufacturing leaders are forecasting today in our State of Manufacturing Report and discover how Tacton helps manufacturers turn configuration and quote data into actionable forecasting and planning insights.  

Back to Resources

How to Manage Engineering Change Orders (ECOs) to Reduce Quote Errors and Configuration Maintenance

Configuration maintenance is consuming engineering resources. Improve your configuration and ECO management to prevent customer quotes from breaking.

How to Manage Engineering Change Orders (ECOs) to Reduce Quote Errors and Configuration Maintenance

Engineering teams are spending too much time and effort maintaining product configuration models. 

According to Tacton’s 2026 State of Manufacturing report, 93% of engineering teams report spending moderate to very high effort maintaining configuration logic across systems. Meanwhile, 81% of manufacturers report moderate to extremely high effort maintaining CPQ models. 

The impact of engineering change orders (ECOs) on quoting accuracy, as well as configuration maintenance across systems like PLM, CPQ, ERP, and MES, is becoming a significant drain on engineering resources. This comes in the form of rule updates, validating product changes, troubleshooting inconsistencies between systems, and ensuring changes are reflected to sales and the supply chain.  

As manufacturers continue to expand configurable product portfolios, finding a more efficient way to manage ECOs and configuration maintenance is becoming increasingly important for responsiveness and continued innovation. 

Why do engineering change orders (ECOs) increase configuration maintenance? 

Every engineering change order creates downstream work. A component replacement may affect product compatibility. A design update may introduce new constraints. A pricing change may require updates to product configurations. A new feature may impact manufacturing processes or sales options. 

Only 33% of manufacturers currently maintain consistent configuration logic across sales, engineering, and production. Even fewer automatically propagate engineering changes across systems. For most manufacturers, configuration knowledge is still being recreated, translated, or manually synchronized across departments. 

Manufacturers don’t have the connectivity to ensure every system, department, and process reflects that change consistently. 

Over time, configuration maintenance can become one of the most resource-intensive aspects of managing product complexity and changes. 

How do you manage engineering change orders in CPQ without breaking open quotes? 

This is one of the most common challenges manufacturers face. 

Sales teams may have active opportunities in progress when an engineering change order is introduced. If product logic is fragmented or configuration models are difficult to maintain, an ECO can create confusion about which configurations remain valid, which pricing rules apply, and whether existing quotes need to be reviewed. 

This leads to manual intervention from engineering teams, delays in the quoting process, and increased risk of errors. 

The most effective approach is ensuring configuration knowledge is managed consistently and changes are governed centrally through a configuration management platform or environment that automatically propagates changes across traditional manufacturing systems, like CPQ, MES, or PLM.  

When engineering changes are reflected through a shared configuration model rather than maintained independently across multiple systems, manufacturers can reduce the risk of inconsistencies that affect active quotes.  

How constraint-based CPQ reduces configuration maintenance 

Many manufacturers assume that increasing product complexity requires increasing the number of configuration rules. 

In reality, the amount of maintenance required often depends on how products are modeled. 

Traditional rule-based approaches typically require organizations to manage growing numbers of dependencies, exceptions, and configuration rules as product portfolios expand. Every engineering change may require additional rules or updates across numerous rules, increasing maintenance effort and introducing risk. 

CPQ with constraint-based configuration takes a different approach. 

Rather than relying on an ever-growing web of rules and exceptions, constraint-based models use product relationships to determine valid configurations. When product knowledge is managed through a centralized 150% BOM (representing all valid product options and components in a single structure), engineering changes can be applied to the underlying product model and reused across sales, engineering, and manufacturing processes, reducing the amount of configuration maintenance required as products evolve. 

This provides several advantages when managing engineering changes: 

  • Fewer rules to maintain 
  • Reduced model complexity 
  • Easier implementation of product updates 
  • Less risk of conflicting logic 
  • Greater confidence that configurations remain valid after changes 

For manufacturers managing large numbers of ECOs, reducing rule maintenance within CPQ can significantly improve engineering productivity while helping ensure configuration accuracy. 

What Is the Best Way to Manage Configuration Changes Across Systems? 

In addition to maintaining a CPQ model, managing ECOs effectively requires a consistent approach to configuration management across the entire product lifecycle. 

Leading manufacturers increasingly focus on three principles: 

Centralize configuration knowledge 

Many manufacturers maintain product structures, configuration rules, BOM logic, and engineering constraints in multiple systems. Every ECO then requires updates in several places, increasing the risk of inconsistencies and rework. A centralized source of product knowledge helps engineering teams manage changes once and propagate them downstream, reducing maintenance effort while improving alignment across sales, engineering, and production.

Build for reuse

Only 7% of manufacturers currently define configuration rules once and reuse them everywhere. Reusable product structures and shared configuration logic reduce the effort required to maintain product models as products evolve. 

Propagate changes efficiently 

When engineering changes can be automatically propagated to production systems, organizations spend less time maintaining duplicate information and more time improving products and processes. 

Engineering change orders will continue. Engineering maintenance pains don’t have to. 

Manufacturers are unlikely to see fewer engineering change orders in the future. 

Product portfolios continue to expand. Customer requirements continue to evolve. Product complexity continues to increase. 

What will separate leading manufacturers is how effectively they manage configuration maintenance. 

The State of Manufacturing report reveals that most organizations still have significant opportunities for improvement. Nearly every engineering team reports substantial effort maintaining configuration logic, while only a small percentage of manufacturers have established reusable, consistent approaches to configuration management. 

The organizations making the most progress recognize that engineering change orders and configuration maintenance are not the same thing. 

While ECOs are unavoidable, excessive maintenance effort is often the result of fragmented systems and disconnected configuration processes. 

By centralizing configuration knowledge, reducing rule maintenance, and adopting approaches such as constraint-based CPQ, manufacturers can manage engineering changes more efficiently and free engineering teams to focus on innovation instead of maintenance. 

Read the full report

Back to Resources

What are manufacturing leaders prioritizing for digital transformation in 2026?

New survey data from 280 manufacturing leaders reveals why the next wave of digital transformation isn't about more tools but about connected ones.

Posted on
|

Share:

What are manufacturing leaders prioritizing for digital transformation in 2026?

Manufacturing leaders are leaning into three fronts simultaneously: move faster on complex deals, make smarter decisions about where to grow, and protect margins that cost pressure is squeezing from every direction.  

Digital transformation was supposed to help with all three, and for many manufacturers, it has. Manufacturing digital transformation in 2026, however, looks different from the last wave. The first wave of transformation automated processes within functions, but automation across functions in the order-to-delivery lifecycle is lacking. Many of the systems manufacturers implemented to get there weren’t built to share data and important product logic across sales, engineering, and production, let alone support the speed and scalability that selling highly customized products demands. 

Here’s what the data says about where the real leverage is in 2026, based on survey data from 280 global manufacturing leaders 

1. The trend toward mass customization grows as leaders look for speed 

Speed is the first casualty of high product complexity, and 67% of manufacturers in the U.S. and Europe are producing very to extremely complex products.  

New and existing configuration rules across thousands of growing product variants and options create a new place for something to slow down. Buyers disengage due to overwhelming product portfolios. Quotes require more engineering input and downstream adjustment.  

More manufacturing leaders are increasing configure-to-order coverage as a direct path to faster, more scalable sales. In 2026, 39% of manufacturers have 20–39% of their portfolio in configure-to-order, while another 30% cover up to 59%, meaning nearly 7 in 10 are running hybrid ETO-CTO models simultaneously. The goal is to reduce the manual, case-by-case effort that engineer-to-order demands by standardizing more of the portfolio into repeatable, configurable modules, but that model only delivers speed if the configuration logic behind it is consistent across sales, engineering, and production. 

Leaders moving fastest on complex deals have one thing in common: they’ve connected the configuration logic of their modular or configurable product options that governs what can be sold to what can be built, thereby removing the back-and-forth that kills cycle time. 

2. Legacy quoting tools aren’t solving for customization  

Although nearly half of manufacturers have adopted third-party CPQ software, with others using homegrown solutions, organizations are still struggling to deliver quotes that are correct and optimized to the customer’s needs. Most can respond quickly to RFQs (within 48 hours for most survey respondents), but legacy quoting and CPQ tools aren’t addressing the need for more intelligent customization.  

Customization is now the number one challenge for sales teams. Manufacturers now need CPQ tools that don’t just address the first problem of speed, but that also address the problem of product complexity.  

Faster quotes that require downstream correction aren’t faster at all: the time lost to engineering review, pricing adjustments, and post-signature changes erases the front-end speed gain Those who invest in guided selling capabilities, AI-driven configuration matching, and CPQ tools that can keep up with configuration rule maintenance see speed and accuracy improve. 

3. Leading IT and the C-suite teams are viewing margin at a bird’s eye  

Dwindling margins won’t be fixed by any single department. They’ll be fixed by having a digital thread that accurate translates one definition of product configuration across PLM, CPQ, ERP, MES, and other systems.  

With 62% of manufacturers experiencing moderate to severe margin erosion across quote to delivery, each part of the value chain contributes due to a lack of people, data, and processes that can work from the same source of truth.  

Margin declines at the handoffs between teams. That means optimizing one department’s process doesn’t fix the total cost. Under severe cost pressure, the instinct is to cut within functions by reducing headcount, tightening procurement, and speeding up production. But the biggest margin leak is the coordination failure between functions that no budget line captures.  

The manufacturers protecting margins most effectively have built shared visibility across the lifecycle, so the cost of a bad configuration decision at quote time is visible before it becomes a change order, a delay, or a reputational problem at delivery. 

4. Strategic leaders know which products and configurations are actually driving growth

Most manufacturers can track revenue and win rates, but less than half (45%) have visibility into which specific configurations, variants, or product options are driving profitability versus quietly adding engineering cost without closing deals.  

This data gap makes strategic growth planning harder than it needs to be. To build the most defensible growth roadmaps, successful leaders can answer questions like: which variants always require manual engineering review? Which configurations correlate with the fastest sales cycles? Which options are specified frequently but rarely convert? 

Having configuration-level data requires a working digital thread so that your organization has the full context of every quote decision. Digital transformation efforts that focus on a connected source of truth will have deeper insights into the configuration behavior that drives portfolio performance.  

5. AI will accelerate growth with engineering teams positioned for immediate gains 

AI—especially generative AI—is becoming ubiquitous. In 2026, 79% of manufacturers are investing in or exploring AI, up from 64% in 2025. The top priorities are practical: automating complex configurations, reducing quoting errors, guided selling, faster RFQ responses.   

But the manufacturers getting the most from AI aren’t the ones who invested in it first. They’re the ones who built the data and workflow foundation that gives AI something useful to work on 

Under intense cost pressures, AI’s most immediate value isn’t automation for its own sake. It’s reducing the maintenance burden that consumes engineering capacity, catching configuration errors before they become margin problems, and surfacing the product intelligence needed to make smarter growth decisions faster.  

The three highest-priority AI use cases tell that story directly: automating complex product configurations tops the list at 56% (the single biggest lever for reducing the engineering validation bottleneck that slows every complex deal). That’s followed by real-time pricing optimization (removing the manual pricing adjustments that pull engineering into commercial decisions they shouldn’t own) and reducing quoting errors and approval delays before they reach engineering. For sales, the gains are equally direct: fewer deals that unravel downstream, faster quote cycles, and commitments that production can keep. 

Where manufacturers see the most potential AI value in 2026

While only 41% of manufacturers currently see AI-assisted CPQ model maintenance as a potential priority, it’s where engineering teams stand to gain the most by freeing capacity from upkeep and putting it back into innovation.  

How to align manufacturing digital transformation for greater speed, growth, and profitability 

The manufacturers who move faster, grow more strategically, and protect profitability under cost pressure in 2026 aren’t doing it with the most expensive tools. Their foundation is built on a single source of truth that automatically aligns each part of the lifecycle. That looks like connected configuration logic, shared data across the lifecycle, and emerging technology built on top of something solid.  

The full data behind these trends comes from 280 manufacturing leaders across 8 countries.  

Download the 2026 State of Manufacturing report. 

Back to Resources

Cut CPQ Implementation Time in Half with Tacton AI Product Modeling Assistant

Tacton's AI Product Modeling Assistant generates near-complete product models from your product data so teams can go live faster and scale further.

Cut CPQ Implementation Time in Half with Tacton AI Product Modeling Assistant

CPQ implementations are known for being long, resource-heavy, and expensive, especially for manufacturers with complex products. Modeling alone can take months, delaying go-live, limiting product coverage, and pushing ROI further out. 

And while CPQ is meant to accelerate sales, the reality is that many teams spend weeks or months just trying to get their product models ready. 

Now, AI is changing that. Tacton AI Product Modeling Assistant is a generative AI co-pilot that helps you turn structured and unstructured data into up to 70-80% already complete models, so you don’t have to start from scratch.  

Increase time-to-value and revenue realization 

Time-to-value is a key driver of CPQ ROI, and product modeling is often the biggest bottleneck. 

Teams work with fragmented data across spreadsheets, PDFs, and PLM systems, manually translating it into configuration rules and constraints. This process is slow, resource-intensive, and difficult to scale. 

And the impact extends beyond implementation: 

  • Go-live timelines slip  
  • Products are excluded from initial rollout  
  • Sales teams can’t quote the full portfolio  
  • Adoption slows due to incomplete coverage  
  • Revenue realization is delayed  


By accelerating this critical phase, the AI Modeling Assistant helps you see faster ROI from your CPQ implementation.  

Tacton AI Product Modeling Assistant: faster, smarter CPQ implementation and maintenance

Purpose-built for Tacton CPQ, the Tacton AI Product Modeling Assistant understands manufacturing product language, including assemblies, modules, attributes, constraints, and configuration logic. It works within Tacton’s configuration structure, and unlike generic AI, applies structured intelligence to generate scalable CPQ models based on how products are built and sold. 

Instead of starting from scratch, teams can generate a structured, CPQ-ready product model using existing product data, even if it’s unstructured. Every AI-generated output remains fully visible and reviewable, ensuring your experts stay in control.  

Natively embedded into the Tacton platform, you can send your final product models right to Tacton CPQ for quoting use. You can also make updates to current product models, such as pricing.  

How AI-assisted product modeling works 

The process is designed to fit into how manufacturers already work:

1. Upload existing product data

Use spreadsheets, PDFs, and technical specifications—no need for perfectly structured inputs. The assistant supports multi-format data ingestion, translating product documentation into structured model components in minutes.

2. Generate a model foundation with AI

The AI Modeling Assistant interprets your data and creates a structured CPQ model, often 70–80% complete from the start. A visual model overview provides clarity across all model components, so teams can understand the full structure at a glance.

3. Review and refine

Your product experts are still essential in validating the model and refining constraint logic. Use a conversational, natural-language interface to make updates, apply prompts to target specific sections, and leverage AI-powered editing to instantly add features, modify attributes, or restructure assemblies.

4. Preview and approve

All changes remain fully visible and governed. Teams can review and validate every AI-generated update before it is applied. 

5. Sync directly to CPQ

Approved models can be pushed directly into Tacton CPQ for testing and deployment, keeping workflows seamless with no export or rework.

CPQ implementation

See how easy it is to create a product model from a PDF.

Product updates

Make faster product updates across your portfolio. See how you can use Tacton AI Modeling Assistant to update pricing.

The benefits of faster CPQ implementation 

AI-assisted product modeling fundamentally changes how teams deploy and scale CPQ. 

  • Accelerate Time to Scale
    Reduce modeling effort up to 50% for highly complex products and up to 80% overall. Expand product coverage faster, so you can scale CPQ adoption without delays. 
  • Reduce Manual and Repetitive Work
    Start with models that are already 70–80% complete and shift focus from setup to refinement and optimization.
  • Upgrade Legacy Logic Without Starting Over
    Turn existing rules and documentation into structured, scalable models while preserving institutional knowledge.
  • Improve Model Visibility and Quality
    Gain clarity across assemblies, attributes, and constraints, in turn reducing errors and additional work.  
  • Scale Output Without Increasing Headcount
    Ramp junior modelers faster and amplify expert productivity without added cost.

Not just hype: Real-world impact with Alimak 

Manufacturers are already seeing measurable improvements. 

Companies like Alimak have reported 40–80% improvements in modeling efficiency, helping them accelerate implementation timelines and bring products to market faster. 

Customers are seeing fewer errors in the modeling process and introducing products to sales faster with fewer full-time resources.  

Get moving with AI-assisted CPQ 

If product modeling has been slowing down your CPQ implementation, or limiting your ability to scale, learn how Tacton AI Modeling Assistant can help you launch faster and scale over time.  

The AI assistant is available as an add-on for current and new customers.  

See it in action.  

Schedule My Demo 

FAQ: Tacton AI Product Modeling Assistant

1. Is my data secure?

Yes. Tacton uses an enterprise-grade environment, and data stays isolated within your Tacton tenant. No cross-customer sharing. No external model training.

2. Do we still need human validation?

Yes. All AI-generated outputs are reviewed and approved by your experts before use. This tool is not meant to replace your experts. 

3. What data can the AI ingest?

Spreadsheets, PDFs, specifications, CAD/BOM exports, PLM/ERP data, and legacy exports from Tacton products.

4. How accurate are the generated models?

The AI generates structured models that are often 70–80% complete, based on your configuration logic and structure within Tacton. From there, experts refine constraints and dependencies to ensure the model meets business and engineering requirements.

5. How does it fit into our workflow?

It’s built into Tacton CPQ, so you can generate, refine, and sync models without extra tools or handoffs. 

Back to Resources

Reducing Buyer Drop-Off in Self-Service Sales of Complex Products: Best Practices

Struggling with abandoned carts? Here’s how manufacturers can keep buyers moving confidently toward purchase.

Share:

Reducing Buyer Drop-Off in Self-Service Sales of Complex Products: Best Practices

B2B buyers mirror B2C buyers increasingly each year. A majority of buyers want a completely independent, online buying experience, but more specifically, they want a relevant buying experience. In fact, 73% of B2B buyers actively avoid suppliers who send irrelevant outreach, making self-service sales a highly effective sales channel. 

A self-service portal lets customers configure and purchase products on their own. A self-service CPQ powers this with guided configuration, real-time validation, and instant pricing or quotes. A well-designed self-service experience reduces early drop-off, improves win rates, shortens sales cycles, and frees sales to focus on particular deals.  

Why buyers drop off in complex product configuration 

Manufacturers cite common reasons for early drop-off in their website self-service portals. Whether you’re building your organization’s first self-service experience or updating an ineffective self-service channel, these are important obstacles to avoid. 

Too many options too early 

Product complexity should be managed early in the online selection process. If you have 50 or more options for a particular product line, buyers might find those first screens overwhelming. Cognitive overload leads to abandonment.  

Buyers need guidance and progressive disclosure that gives them the best options upfront, based on their specific performance needs. 

Invalid or dead-end configurations 

A sequential configurator is a product configuration tool that forces users to move through choices in a fixed, step-by-step order (Step 1 → Step 2 → Step 3). Each selection unlocks the next stage, often without showing the full picture up front. If not designed well, this can lead to dead ends or late-stage incompatibilities that result in abandonment.

The solution is to replace rigid sequences with a constraint-based CPQ engine integrated into your website’s self-service portal. This means the system understands product rules and dependencies and evaluates them in real time, automatically preventing incompatible selections and filtering alternative options as the buyer configures. Instead of discovering errors at the end, every configuration stays valid as it’s built.

No pricing transparency 

Buyers want to see cost impact immediately. Price is often revealed after configuration submission, but many buyers want the ability to compare pricing and confirm budget internally. Budget uncertainty stalls decisions.  

Real-time, contextual pricing updates can make or break your buyer’s decision to move forward with a more transparent competitor. 

Performance friction

Performance directly impacts completion rates. Slow load times, branding inconsistency, and technical barriers are all reasons to drop off early in the buying journey.  

Choose a reliable tool that can handle configuration volume, complexity, and easy UX customization to match your brand without disruption. 

No save-and-resume

Sales cycles are long. Complex purchases are rarely evaluated in a single session or by a single person. When buyers can’t save their configuration or cart, they’re more likely to see your sales process as difficult and time consuming.  

Best practices for designing a high-converting self-service sales portal 

These online configurator best practices are designed to help you build trust with buyers and push them toward decisions faster. 

Start with guided selling, not technical specifications 

Not all buyers are technical. While you can ask for required length, width, or component specs, you can increase the value of your solution through needs-based configuration.  

Guide sellers based on their specific use case, their performance requirements, their environmental conditions, and other outcome-based requirements that demonstrate why this product is the best option.  

  • Lower expertise barrier 
  • Speed time to first viable solution 
  • Increase buyer confidence

Make progress reversible and solutions comparable

Complex purchases feel risky. Buyers drop off when they’re unsure how far they’ve gone, how much is left, or whether they can safely adjust or compare decisions. 

Allow easy backtracking without losing work, and real-time validation as they make adjustments to their configuration. Reinforce that selections can be modified or compared. 

Provide real-time visual feedback 

In addition to thorough product descriptions, a 3D product configurator is table stakes for modern manufacturers. Providing live 3D and even augmented reality (AR) visualization within your online self-service portal allows buyers to see and share what the solution looks like and how it fits into their space. A mobile 3D visualization increases the likelihood of closing a deal.  

  • Higher buyer confidence 
  • Faster internal approvals 
  • Reduced back-and-forth

Make pricing contextual 

Pricing should reflect who is buying and what they’re selecting. Show indicative or list pricing during configuration, then dynamically apply dealer, partner, or customer-specific pricing based on login, account status, or ERP data. Clearly highlight how each option impacts total price in real time. 

When pricing adjusts to the buyer context and updates transparently as selections change, it reduces surprises and speeds up decision-making.

Support both simplicity and complexity 

Provide different pathways for different levels of technical buyers. Some buyers may already know the SKU they need, while others may be introduced to your product for the first time. Give an option upon login to enter a product SKU, go straight to a product type, or to search based on their application or use case.

Enable seamless sales handoff  

A basic online configurator should easily transfer data directly to a sales representative, so they can see the buyer’s information and specific requirements. 

A best-in-class experience, however, also supports sales collaboration with the buyer. For example, a sales rep can step in mid-configuration, suggest optimized alternatives, adjust pricing for a strategic account, or help navigate trade-offs without restarting the process. When sales can intervene throughout the self-service journey, it preserves momentum opens the discussion to greater value. 

Best practices for implementing a successful customer self-service tool 

A reliable self-service tool is just as important as its features, and how you support this tool can be the difference between a closed deal and a dead end.  

Integration helps data flow seamlessly 

Can your portal seamlessly pull ERP pricing, updated PLM data, and feed configurations directly into your CPQ without heavy custom development? 

A centralized CPQ tool unifies configuration and pricing and simplifies integration with your broader data stack. While APIs can connect CPQ to your website, embedding CPQ-powered HTML components directly into your site ties the user experience natively to the configuration logic without rebuilding the front end from scratch. Because these components live within your existing web framework, you can apply your own styling and brand standards, while still running on the same real-time rules, pricing, and product model as your internal sales process. 

Permissions and access give you more control and consistency 

Self-service sales must be governed, not open-ended. Role-based permissions ensure the right users see the right products, pricing, and capabilities, whether internal sales, dealers, partners, or public buyers. Margin visibility, discount authority, and configuration access must be controlled centrally. Without structured access and permissions, self-service can introduce pricing risk and channel conflict.  

For the end buyer, this internal governance translates into a more consistent and predictable experience. They see pricing that reflects their specific agreement, region, or channel, rather than generic list prices that change later. They aren’t exposed to products they can’t purchase or options that require hidden approvals. 

Choose the products that make the most sense 

Define which products to make available based on their business impact and complexity. ETO products will naturally have to be sold through direct sales with a human, especially as they require engineering support. Starting with accessories and low-to-medium complexity products—even one or two product lines at a time—reduces the risk of confusing buyers and losing them early.  

Pilot before full public launch for a faster path to value 

Before making self-service configuration available to your direct customers or your dealers’ customers, provide training and testing across regions and channels for immediate feedback and trouble-shooting. Early praise can lead to faster expansion of your online sales channels.  

How self-service CPQ improves win rates and sales speed 

When self-service is done right, your business creates an always-on revenue channel that reduces the need for more sales and engineering resources. Internal sales reps are not replaced, but are leveraged for more impactful deals and late-stage, high-intent conversations.  

Self-service CPQ and online configuration: 

  • Reduces engineering involvement in early stages 
  • Eliminates rework from invalid configurations 
  • Shortens quote turnaround 
  • Improves buyer confidence 
  • Keeps buyers engaged longer 
  • Converts more self-educated buyers into closed deals 

Evaluate your self-service readiness 

Are your buyers dropping off mid-configuration? Are sales often redoing invalid quotes? Are customers waiting days for pricing feedback?  

Tacton Self-Service Channels embeds Tacton CPQ directly into your website so your buyers can create valid configurations or quotes quickly and confidently with relevant information for their business applications. Tacton CPQ uses constraint-based configuration to generate engineering-valid quotes, built specifically for manufacturers of highly configurable products.  

Learn more about Tacton Self-Service Channels

Back to Resources

Mastering Mass Customization: Best Practices for Increasing Configure-to-Order Coverage

A practical roadmap for shifting from 100% engineer-to-order to increased configure-to-order manufacturing, reducing complexity and scaling sales with better margin.

Share:

Mastering Mass Customization: Best Practices for Increasing Configure-to-Order Coverage

Transitioning from engineer-to-order (ETO) to configure-to-order (CTO) means standardizing repeatable configurations, so you can scale sales without overwhelming engineering. It’s not about eliminating customization but shifting toward mass customization with a more balanced hybrid model that reduces bottlenecks while preserving flexibility. 

Done well, increasing CTO leads to faster quoting, fewer errors, stronger margins, and growth that isn’t limited by headcount. This roadmap outlines the key steps and common pitfalls to help you make that shift successfully. 

What does an ETO to CTO transition actually mean? 

ETO manufacturing models are defined by complete customization, where no components are standard. CTO manufacturing models use standardized modules that can be combined to create flexible, yet validated solutions that don’t require heavy engineering and design support.  

Many manufacturers operate in a hybrid model, but increasing CTO adoption is a goal for companies that are tasked with increasing sales without increasing engineering headcount.  

Why manufacturers are increasing CTO coverage 

Greater CTO coverage means more control over your sales and production functions. When you have modular products whose configurations can be constrained by automated, validated engineering rules, you open the door to multiple opportunities.  

  • Shorter quote cycles and competitive response times with fewer engineering bottlenecks.  
  • More time for engineering teams to handle exceptional projects and high-value innovation. 
  • Scalable sales that don’t require excessive product knowledge across your sales teams.  
  • The ability to expand sales channels to include ecommerce or self-service buying where customers can configure valid, standardized components independently.  
  • Fewer surprises and rework downstream, resulting in less margin erosion. 

Step-by-step implementation roadmap for moving from ETO to more CTO 

Fundamental transitions like these should happen in phases to reduce risk and ease your organization into the new process. These implementation steps for CTO manufacturing help you transition without major disruption to your business.  

Before taking on this project, create your business case: Answer the following questions:  

  • How many hours are spent on non-winning quotes? 
  • What percentage of quotes require engineering input? 
  • What’s the average engineering time per quote? 
  • What’s the conversion rate of ETO quotes? 

Phase 1: Assessment and readiness 

Identify your high-volume product families. Define repeatable configurations from true, custom work, and look at the products that have the most quoting effort or engineering involvement to alleviate some of that burden. Use configuration-level quote data to identify which components, options, and combinations are repeatedly configured and ordered. Patterns often reveal that more is repeatable than teams believe.  

Then, evaluate PLM, ERP, and pricing data quality. Is there integration complexity that makes it difficult for teams across regions to work from the same data or configuration logic? Document inconsistencies and ownership gaps.  

Finally, define your business objectives. What is your target quote turnaround time? What is an acceptable CTO/ETO split? Metrics like margin, win rate, or even tool adoption will best measure the success of increasing CTO coverage.  

Phase 2: Pilot and modeling 

Don’t move all at once. Begin with a single product line that your organization feels will have the highest business impact. Choose a product line with moderate complexity first, strong internal ownership, and good data availability. Cleaning up data and product values is crucial for the next step: product modeling.  

When modeling in CPQ, translate engineering logic into rules or constraints. Define valid combinations and dependencies. Embed pricing logic. Maintain controlled exception pathways or alerts when a configuration requires an engineering override or an ETO exception.  

In addition, approvals (e.g., discount approvals or business approvals) and margin governance should be built into your quoting tool for the best line of control.  

Phase 3: Integration and commercial alignment 

Your team can’t scale sales if they’re working from different data and systems. Configuration logic should be your single source of truth across the organization, with strong integration between PLM (product data), ERP (pricing, orders), CRM (opportunities), and CPQ (quoting).  

Phase 4: Change management and adoption 

One of the biggest obstacles to increasing CTO coverage is objection from internal stakeholders—especially engineering teams.  

Position CTO as scaling expertise rather than replacing it. Provide communication early in the process by explaining the business reasons and value of a hybrid manufacturing model. Create champions within your teams and bring engineering and sales into the transition process to own new processes, product logic, and workflows.  

Structured training is key. Phasing your transition also reduces disruption to your business and proves value one product, region, or channel at a time, so your internal success stories fuel further buy-in. 

Phase 5: Formalize the “exception to standard” conversion loop 

Continue to track repeated ETO requests. After X occurrences, evaluate for potential CTO inclusion and assign ownership for rule addition and portfolio documentation.  

What modular CTO and mass customization looks like at scale 

For many manufacturers, the objective of increasing CTO coverage is to reduce engineering bottlenecks, shorten quote cycles, expand sales channels, and create tighter control across systems. Piab’s experience illustrates what that looks like when modular design is structured for scale. 

Piab, a global manufacturer of vacuum automation and lifting solutions, already established a modular manufacturing model and wanted to scale. By centralizing and standardizing its modular logic within an integrated CPQ connected to ERP, pricing, and documentation, Piab turned product flexibility into scalable commercial capability across its company with great results: 

  • 40,000+ monthly self-service configurations, enabling customers and partners to generate validated solutions independently. 
  • 58,000+ configured ERP items, converting repeatable configurations into modular order components. 
  • 6,000+ automatically generated documents per month, accelerating validation and reducing manual engineering effort. 

The 10 most common mistakes in expanding CTO coverage 

Avoid these common pitfalls when shifting from ETO to CTO:

1. Automating a broken quoting process

Digitizing an unclear or inconsistent ETO workflow only scales inefficiency. Redesign poorly governed approvals, exception handling, ERP consistencies, or sales–engineering collaboration before automating.

2. Trying to standardize 100% of products

Eliminating ETO entirely creates resistance and removes strategic differentiation. Structure exceptions with controlled approvals instead of eliminating them. 

Build approved alternatives into your configuration logic so flexibility doesn’t require full engineering involvement. For example, allow pre-approved component or control system brands (e.g., ABB vs. Siemens) within defined rules rather than triggering custom design.

3. Skipping product modularization

“Our product structures are not mature enough.” 

If platforms, options, and dependencies aren’t clearly defined, rule complexity explodes. Clean up product architecture before modeling configuration logic.

4. Underestimating data preparation

Poor product, pricing, or ERP data delays modeling, complicates system maintenance, and erodes trust. Define governance and ownership early. 

5. Failing to define rule ownership 

Eventually, configuration rules become outdated, and without ownership, teams blame each other and sales bypasses the system completely.  

Assign responsibility for rule maintenance, pricing logic, and lifecycle updates.

6. Ignoring exception governance

Unchecked overrides and manual workarounds quickly erode margins. Define escalation workflows and convert repeated exceptions into standard options.

7. Scaling before stabilizing

Expanding across regions or systems too quickly multiplies inconsistencies. Prove and stabilize one product line before scaling.

8. Underestimating integration complexity

PLM, ERP, CRM, and CPQ alignment is foundational. Scope integrations deliberately. Don’t assume they’ll “work themselves out.”

9. Treating CTO as an IT project

This is a commercial transformation. Executive sponsorship and cross-functional alignment are critical.

10. Measuring adoption instead of business impact

Go-live date is not the impact metric. Track engineering hours saved, quote turnaround time, margin performance, and CTO/ETO ratio over time. 

Move from reactive engineering to scalable configuration 

Scaling modular CTO requires structured configuration logic, integrated systems, and governance that supports growth over time. It also requires visibility. 

Tacton CPQ helps manufacturers not only translate complex product architecture into scalable, constraint-based configuration, but also analyze configuration-level quote data to identify repeatable patterns, recurring exceptions, and components that are strong candidates for CTO expansion. 

See how we help manufacturers increase CTO coverage strategically.  

Request a Demo 


Frequently asked questions about CTO 

Is expanding CTO coverage right for everyone? These questions or objections may sound familiar.  

Q: Can we move to CTO with highly complex products? 

If you manufacture highly configurable products, your pride yourself in the complexity and uniqueness of your product. But complexity does not eliminate all repeatable patterns.  

Repeatable configurations are always possible, and regulatory and performance variations can often be modularized.  

Q: Will moving to CTO reduce our ability to handle custom requirements? 

Entirely ETO or CTO manufacturing models are unsustainable. A hybrid CTO-ETO model that uses controlled escalations for true edge cases is the best model for complex manufacturers. CTO handles volume, while ETO handles differentiation.  

Q: How long does an ETO to CTO transition take? 

The transition requires standardized configuration logic to be digitized in a quoting tool, such as CPQ. That implementation can be longer for homegrown tools or as little as four to six months for a purpose-built CPQ software.  

However, the full transition could take much longer, depending on how many products are piloted and how much of the portfolio is phased in over that journey.  

Q: What resources are required? 

Besides quoting tools to scale and streamline sales, your greatest resource is people. The following stakeholders are essential for making the transition from ETO to CTO manufacturing.  

  • Business process owner(s) 
  • Product modeling experts 
  • Sales and engineering key users 
  • Integration and IT support 
  • Executive sponsorship 

Q: What ROI can we expect? 

By streamlining sales and quote validation, you can reduce quoting time from weeks to hours, with additional margin uplift through pricing control and reduced order errors or rework.  

Faster response times also yield higher win rates against slower competitors. 


Back to Resources

Make B2B Self-Service Ordering Easy with Tacton Self-Service Channels for Manufacturers

Learn how Tacton’s new Self-Service Channels makes it easier than ever to launch a self-service online configurator for complex products.

Share:

Make B2B Self-Service Ordering Easy with Tacton Self-Service Channels for Manufacturers

The line between B2C and B2B sales continues to blur. Even buyers of highly configurable products want the same independent, immediate, and simplified online buying experience they get on Amazon or Uber. Yet, while 67% of buyers want a rep-free, self-service buying experience, only 24% of manufacturers prioritize self-service as a sales channel. 

Manufacturers of complex products have an opportunity to gain advantage against competitors with faster sales cycles, fewer human errors, and an easier way to explore your products. Tacton Self-Service Channels (SSC) takes customer self-service ordering to the next level, removing the need for advanced API setup with an easily embeddable website quoting experience. Enhance buyer engagement and sales-buyer collaboration across the sales cycle. 

What is Tacton Self-Service Channels?  

Tacton Self-Service Channels (SSC) allows you to embed powerful quoting capabilities directly into your website, powered by the exact same product rules, pricing logic, and validation engine used in your internal Tacton CPQ. 

Using ready-to-deploy HTML components, you can embed this experience without building a custom solution from scratch. While customers can continue using the original API-based Customer Self-Service, SSC makes it significantly easier to launch a fully branded online buying interface and, soon, will support sales-buyer collaboration earlier in the process. 

Tacton SSC includes: 

  • A quick, basic setup once your product model is ready. 
  • HTML components you can drop directly into your site. 
  • One product model, one pricing logic, one source of truth across all channels (OEM, dealer, partner) directly from your Tacton CPQ configurator. 

Earlier collaboration across the sales cycle 

Unlike the first-generation Tacton Customer Self-Service tool, SSC is designed for collaboration. The original Customer Self-Service tool keeps the process isolated until the buyer completes configuration and submits it. Sales can only engage at the end. 

With the new Self-Service Channels, sales staff and support will soon be able to step in at any point, including reviewing configurations, adjusting pricing, collaborating on proposals, or guiding complex deals before a final quote is issued. Buyers can start independently, and your team can join when it adds value.  

Rather than replacing sales reps through independent buying, this tool gives sales the opportunity to close faster and exert control over the sales experience.  

Tacton SSC scales revenue with control 

A streamlined self-service tool gives your buyers a consistent, accurate experience of your products. It also gives internal teams the ability to scale sales sans the additional costs.  

  • Ensure consistency everywhere: Power internal sales, distributors, retailers, and web buyers from the same product catalog. Product and pricing changes propagate across all channels automatically. 
  • Offer flexible access: Enable anonymous browsing or require login for personalized experiences. 
  • Protect pricing integrity: Use role-based pricing so distributors see their pricing, not your margins. 
  • Maintain approval control: Launch with quote-request-only workflows and require manual approval for sensitive or high-value quotes. 
  • Control product exposure: Decide which products are available externally and which remain internal-only. 
  • Sell faster: Sales teams spend less time on basic quoting and more time closing strategic deals. 
  • Guarantee valid quotes with fewer engineering hours: Engineering stays focused on innovation instead of validating configurations. Every configuration follows the same rules used by your internal CPQ. 
  • Reduce tool complexity: IT extends CPQ securely without adding system complexity. 
  • Scale revenue: Executives scale revenue without scaling operational costs. 


The shift toward self-service is already happening across manufacturing. As business analyst at Meyn Food Processing Technology, Sicco Saft, recently shared when asked about the future of digital sales tools: 

“Today everybody has e-commerce. We get more and more people retiring. We have less workforce and a lot of customer demand. So self-service is the way forward.” 

Tacton self-service channels interface

How to get started with Tacton SSC 

Tacton SSC does not automatically replace the first-generation customer self-service tool for current users. Likewise, new customers will not be able to purchase the old self-service tool.  

Speak with a Tacton representative to learn more about how Tacton Self-Service Channels integrates into your larger channel strategy.  

Request a Demo 

Frequently asked questions about Self-Service Channels

Can we control what pricing customers see?
Yes. You control pricing visibility (including no pricing visibility) through login requirements, role-based pricing, and optional approval workflows before quotes are finalized. 

Do we have to allow customers to place orders automatically?
No. You can limit the experience to quote requests only and require manual review before issuing firm quotes or accepting orders. 

Can customers save their progress in the self-service experience?
Yes. If you enable login functionality, users can save configurations and return later to complete or revise them. 

Does Tacton track the end user directly?
No. User logins and customer data remain controlled by you, not Tacton. 

Will Self-Service Channels support system configuration?
Yes. Self-Service Channels supports full configuration setup with assistance during implementation. 

How is pricing structured for Self-Service Channels?
Pricing is consumption-based. 

Back to Resources

Engineer-to-Order vs Configure-to-Order: How to Find the Right Balance in Complex Manufacturing

How much of your business truly needs fully engineered-to-order products? Learn how to strike the right balance and uncover hidden CTO potential.

Engineer-to-Order vs Configure-to-Order: How to Find the Right Balance in Complex Manufacturing

How much of your business is truly engineer-to-order, and how much should be? 

Engineer-to-Order (ETO) and Configure-to-Order (CTO) are two manufacturing models that determine how products are designed, quoted, and produced. 

In true ETO manufacturing, every order requires new engineering. Designs start from scratch with each order, and capacity is limited by available engineering headcount. That level of customization can be strategic, but it’s also expensive and hard to scale. 

In configure-to-order (CTO), products are built from predefined, standardized modules and rules. Sales can move faster and growth isn’t constrained by engineering bandwidth. But pushing too far can limit flexibility where it actually matters. 

Many manufacturers overestimate how much of their portfolio needs to be ETO. As customers reward faster response times and sales volumes increase, having the right hybrid between ETO and CTO manufacturing allows manufacturers to balance innovation with operational predictability.  

ETO vs CTO manufacturing: strengths and limitations 

Manufacturers often overestimate their current level of customization due to a misunderstanding of what constitutes ETO and CTO manufacturing.  

Reality of ETO manufacturing

What is engineer-to-order (ETO) manufacturing? 

In true ETO manufacturing, each project is completely unique. Each component is designed or heavily engineered after order intake.  

Due to their high customization, unique configurations are often driven by site-specific conditions (e.g., wind loads, snow loads, earthquake loads), regulatory variables (e.g., electrical compliance, pressure vessel compliance, emissions), and customer-specific performance needs (e.g., precision tolerances, torque).  

Why adopt ETO?

  • Customers have the ultimate flexibility in their solution.  
  • ETO supports unique or emerging use cases not supported by standard components.  
  • ETO enables and encourages deep engineering differentiation and innovation.  

What are the limitations of ETO?

  • ETO manufacturing models have long sales cycles and lead times (up to months or years) due to heavier engineering input and customer scope creep. 
  • Heavy customization requires more product expertise, which strains engineering and product teams.  
  • Manufactures face more manual processes and rework as components are not digitally standardized. 
  • Reliance on engineering makes it difficult to scale sales without adding headcount. 
  • Lack of predictability in configurations, pricing, and production leads to inconsistent margins. 

What is configure-to-order (CTO) manufacturing? 

The CTO manufacturing model is based on building products from repeatable, predefined components or assemblies that can be combined in different ways to meet customer needs.

Many manufacturers that believe they operate fully in an ETO model often discover that large portions of their products are actually repeatable. Core components or assemblies are standardized, while only certain elements require customization.

In CTO, engineering knowledge is captured and structured into rules, enabling sales teams—or even customers—to configure valid solutions without requiring engineering involvement for every deal.

It’s important to note that not all CTO models are fully modular in the same way.

  • In more advanced, modular CTO models, products are built on a structured architecture (often a 150% Bill of Materials) that consists of a product with an assembly structure where each piece can be switched out with interchangeable components. Larger, more complex products may include multiple layers of assemblies with interchangeable components.
  • In other cases, CTO may be less formalized, where teams define what the configuration will be within certain boundaries, without a fully modular structure.
  • Many manufacturers operate in a hybrid CTO + ETO model, where standard configurations handle the majority of demand, and true customization is managed through controlled engineering exceptions.

Configure-to-order models versus SKU models

CTO is not the same as a SKU model or standard consumer product.  

A SKU model sells fully predefined products — each variant already exists and is ordered as-is. There’s no configuration at the time of sale. 

Configure-to-order (CTO) uses standardized components and rules to create a valid, customer-specific solution during the sales process. 

If you try to manage high product complexity with pure SKUs, you end up with SKU explosion. If you try to manage it with pure ETO, you overload engineering. CTO sits in the middle. 

Why adopt CTO?

  • CTO allows faster quoting, because customization affects selection, not core design.  
  • When components are already validated and established within CPQ, there are fewer configuration and quote errors.  
  • CTO enables more customer self-service and guided buying, which scales sales processes by reducing the need for always-on sales teams and engineers. 
  • Manufacturers who have repeatable, standard components have higher data visibility into which variants are actually sold and how often.  

What are the limitations of CTO?

  • Engineers and product teams often respond with fear of reduced flexibility. 
  • Standardizing and codifying product and configuration logic requires upfront modeling effort in CPQ. 
  • CTO requires structured data and teams to be working from the same PLM data. 
  • Organizational change and change management are trickier when sales and engineering processes must fundamentally change.  

For most manufacturers, the real opportunity is not replacing ETO, but shifting more business into structured CTO where possible. 

ETO vs CTO: what changes for your business? 

ETO vs CTO outcomes

When ETO is strategically necessary 

It’s common to believe that you “never sell the same thing twice.” While this is on the far side of the spectrum, not all customizations should be eliminated. Engineer-to-order models can be optimized with great success

ETO remains critical when: 

  • Truly unique customer requirements drive value.  
  • Unique requirements lead to new product development or market entry.  
  • Economically, a specialty project is low-volume but high-margin.  

The goal is to reserve engineering effort for high-value differentiation, which requires some transition to CTO manufacturing models.  

The business case for increasing CTO manufacturing

Quoting cycles can range from days to months, and buyers expect rapid pricing and quoting, even if price isn’t the final decision factor.  

CTO manufacturing brings speed to manufacturers bogged down by engineering or pricing back-and-forth.  

In addition to speed and response times—which often determine win rates and competitive positioning—there are several strategic benefits to increasing CTO products.  

Shifting left from ETO to CTO

8 reasons to expand CTO manufacturing

  • Sales volumes are rising, but headcount isn’t scaling with demand. 
  • Distributors, partners, and customers can’t generate accurate quotes independently. 
  • Revenue growth remains unpredictable and tied to engineering capacity. 
  • Rework and order errors consume time and erode customer trust. 
  • Critical product knowledge walks out the door with retiring experts. 
  • Sales onboarding takes months—sometimes over a year—to reach proficiency. 
  • Sales execution and customer experience vary across regions and channels. 
  • SKU sprawl and redundant parts create supply chain inefficiencies you can’t easily untangle. 

Common objections to CTO—and how to rethink them 

Recalibrating your mix of ETO and CTO products is not a simple switch. It’s no surprise that internal stakeholders will have objections.  

“We’ll lose flexibility.” 

When you dig deeper into your orders, how many are truly unique?  

Focus on identifying which products or features truly require engineering. Moving just a fraction of orders from ad hoc engineering to standardized configuration can improve margins, reduce lead times, and free up engineering capacity. Edge cases can still be managed through controlled engineering escalation, supported by clear approval workflows for exceptions that fall outside standard rules. 

“Our products are too complex.” 

Complexity is the reason to adopt CTO, not avoid it. 

CTO makes complexity manageable through rules, constraints, and guided selling. Without structure, complexity drives longer sales cycles and inconsistent margins. By translating engineering logic into rules and constraints, you enforce valid combinations automatically. The complexity stays behind the scenes; the sales experience becomes guided and reliable.  

“Our data isn’t ready.” 

Is data messy or missing completely? Is data scattered across multiple PLM systems or are entire data fields missing? 

Transition is iterative, not a one-time overhaul. Start with one product line, such as a core product line. Clean and structure data incrementally and treat cleaning data as part of an essential journey toward data maturity.  

“Implementation could take years.” 

Yes. It’s a journey, but one that has long-term benefits on your top and bottom line. 

Remember, value can be realized in phases. Pilots reduce risk, and the ROI from faster quoting and error reduction can offset the investment.  

“Engineering will resist this.”  

There is always concern about the fear of losing control over product integrity, or that sales will misconfigure complex solutions. Engineers don’t want their expertise undermined or their innovations to be dumbed down.  

CTO captures and scales engineering expertise through rules that protect product integrity. Instead of reacting to sales support requests, engineers focus on architecture, innovation, and optimization. 

Ready to shift the balance to hybrid ETO-CTO manufacturing? 

Shifting from ETO to a more balanced CTO model doesn’t mean sacrificing flexibility or engineering expertise. It means applying structure where it creates scale and protecting customization where it truly adds value. If you’re evaluating how to move in that direction, the next step is a strategy conversation.  

Tacton CPQ helps complex manufacturers master ETO and CTO workflows through a constraint-based configuration engine and guardrails that preserve product integrity while giving your customers the flexibility they want.  

Learn more

Back to Resources

How to Measure Product Portfolio Performance in Complex Manufacturing: Metrics to Track

Product portfolio optimization helps manufacturers improve margins and reduce complexity by using configuration-level data to evaluate deeper product performance.

How to Measure Product Portfolio Performance in Complex Manufacturing: Metrics to Track

Product portfolio management in complex manufacturing is the process of deciding which products, variants, and configurations to maintain, simplify, or retire based on profitability and demand. As manufacturers move from engineer-to-order to configure-to-order models, product portfolio complexity becomes harder to manage and optimize.  

Your current product portfolio decisions may rely on aggregated ERP or CRM data. But average margin or total revenue rarely reveal which configurations actually drive profitability and when.  

These product portfolio metrics within CPQ will help you understand how to simplify and rationalize configurable products to prioritize your most profitable opportunities.  

How to go deeper with portfolio optimization  

Many manufacturers manage product portfolios at the SKU level. In configurable environments, that approach can oversimplify the commercial impact of certain configurations or customer requirements.  

Profitability and sales performance are also determined by configuration choices, rather than simply product families. Two variants under the same type of product can perform dramatically differently across margin, win rate, and regional demand. 

In configurable manufacturing environments, portfolio management must go beyond final product analysis and examine configuration-level performance metrics as they relate to margin, win rate, and even regional performance. 

Where do configuration-level product portfolio metrics come from? 

These metrics are generated from configuration and sales data captured during the quoting and ordering process. 

By analyzing configuration-level data, including selected attributes, variants, win/loss outcomes, margin rates, and territory performance, manufacturers can connect engineering decisions directly to commercial results. 

This requires analytics that sit within CPQ and configuration systems. 

Who should use product portfolio metrics from CPQ data? 

Product portfolio metrics are not owned by one department. In complex manufacturing, they require cross-functional visibility: 

  • Engineering leaders use them to rationalize variants and reduce unnecessary complexity. 
  • Product managers evaluate performance across markets and segments. 
  • Sales leaders assess win rates and margin performance by territory. 
  • Executives use portfolio data to align profitability with long-term strategy. 

How to measure product portfolio performance in complex manufacturing: 5 insightful metrics  

By simplifying product portfolios and eliminating unnecessary options for your customers, you create greater bandwidth for innovation and engineering focus, faster sales cycles, and prioritization of higher value opportunities. 

What are the performance metrics that every manufacturer needs to know for deeper product portfolio management? 

Metric: Win or loss rate by product attribute  

In CPQ (Configure, Price, Quote), a product attribute is a specific characteristic or property of a product that can be selected, configured, validated, or used in pricing logic during the quoting process. For example, a product attribute may be an engine type, a body length in a heavy vehicle, or even a wall color for an elevator.  

When analyzing win rates on the attribute level, you may find that in an industrial machine, selection of Spanish or French for control panel language is associated with a substantially high win rate of 50%. Or, heavy vehicles with vinyl seats selected have a very high win rate. Now, you know how to increase the likelihood of a configuration being successful.  

On the other hand, loss rate by product attribute is equally informational. Perhaps medical trays with 60 instruments or more have very low win rates—too complex. Now you know whether you should refine the product or move it from configure-to-order (CTO) to an engineer-to-order (ETO) process for special approval and processing only.  

Metric: Sales by product attribute or value  

Analyzing sales by specific product attribute, such as installation site country, application type (e.g., home, commercial, office), or sales channel (e.g., direct vs. self-service) gives product managers and engineering teams a much clearer view of real functional demand.  

Instead of relying on assumptions in market needs, product stakeholders see which configurations actually convert in which contexts. For example, if a certain feature set consistently wins in commercial applications but underperforms in residential, that signals where to focus roadmap investment, standardization, or simplification. Similarly, strong performance in one country may justify regional variants. 

This kind of functional needs analysis supports smarter portfolio optimization. Engineering can prioritize high-revenue configurations and eliminate low-performing combinations that add complexity without driving revenue. Product managers can also tailor packaging, for example, by channel and simplify offers for self-service while preserving advanced options for direct sales. The result is fewer SKUs, lower operational complexity, and a portfolio shaped by real market demand. 

Metric: Average margin rate per deal  

Looking at average margin by territory can reveal important performance gaps. For example, Brazil may show both a strong win rate and healthy average margins of 20%, while Canada closes a similar number of deals but at significantly lower margins. 

This insight helps you determine whether pricing adjustments are needed, whether discounting behavior differs by region, or whether market conditions justify a different margin target. Instead of focusing only on win rate, you can balance growth with profitability and make deliberate decisions about where and how to protect margin. 

Metric: Cross-analysis by product attribute or configuration parameter  

Cross-analyzing attributes against defined configuration parameters — such as installation site country, application type, building size, or sales channel — uncovers meaningful patterns in buyer behavior. For example, you may discover that customers in Germany consistently select lower energy output components than those in the U.S., or that high-rise construction projects are more likely to go through direct sales rather than self-service. You might also find that certain cabinet locations correlate with stricter noise requirements. 

These insights allow you to adjust pricing, refine packaging, guide sales conversations, or even regionalize your product strategy. But to unlock this value, the relevant parameters must be clearly defined and structured within your CPQ process. Without consistent data capture at the configuration level, these patterns stay hidden.  

Metric: Number of solutions by category  

Tracking the number of solutions sold by category helps identify what is and isn’t moving. For example, if your “High-Performance 6000 RPM Motor” configuration has seen little to no sales over multiple quarters, it may be adding unnecessary complexity to engineering, pricing, or inventory management.

Low- or zero-volume categories that have been included in zero solutions can often be consolidated or removed from the portfolio entirely to reduce SKU sprawl and operational overhead. While ERP shows what ultimately shipped, CPQ data provides visibility into configured solution categories and demand patterns that may not be obvious from finished goods data alone. 

What product performance metrics enable 

Together, these product portfolio performance metrics allow manufacturers to: 

  • Identify underperforming variants 
  • Rationalize product complexity using commercial data 
  • Align engineering decisions with real-world demand 
  • Move from anecdotal portfolio management to measurable optimization 

Proactively optimize your portfolio of highly configurable products 

Portfolio optimization requires designing products and configurations that support profitable, repeatable decisions. Tacton’s CPQ-embedded analytics gives product managers and engineering leaders direct visibility into how configuration choices impact win rates, margins, sales velocity, and portfolio complexity. 

Engineering-led metrics connect product design decisions to commercial performance, helping teams identify which variants to scale, which to simplify, and where complexity slows growth. Configuration-level data equips stakeholders to strengthen both portfolio strategy and execution. 

Discover our analytics capabilities

Back to Resources

6 Things Your ERP and CRM Can’t Tell You About Sales and Product Performance

ERP and CRM show what happened in your sales process, but configuration-level data from CPQ reveals why deals move or stall.

6 Things Your ERP and CRM Can’t Tell You About Sales and Product Performance

ERP and CRM systems provide critical operational and pipeline data, but they weren’t designed to capture configuration-level insights during the quoting process. For manufacturers selling highly configurable products, that gap leaves blind spots in sales performance, margin protection, and product portfolio decisions.

CRM shows pipeline activity, customer interactions, and win/loss outcomes. ERP connects finance, operations, and order data, revealing costs and margin after deals close.

But when manufacturers ask deeper questions, like ‘Why are some quotes converting faster?’ ‘Why is margin eroding despite pricing discipline?’ or ‘Why do certain products stall in the sales cycle?’ ERP and CRM alone can’t provide the answer.

CPQ captures configuration-level decisions made during quoting, providing a pathway to understand why deals move forward, stall, or erode margin. These decisions give manufacturers another layer of insight needed to make smarter business moves.

What is configuration-level data?

Configuration-level data captures every decision made during the Configure, Price, Quote (CPQ) process, including:

  • Selected and rejected options

  • Variant combinations explored

  • Revision counts

  • Pricing adjustments

  • Abandoned configurations

  • Time spent in each quoting stage

Unlike ERP and CRM data, configuration data reflects decision behavior before an order is finalized. When evaluating ERP, CRM, and CPQ within your overall tech stack, this is a critical difference: CPQ data helps you analyze configuration decisions associated with won deals, stalled deals, or reduced margin.

What are the limitations of ERP and CRM for sales and margin insights?

CPQ data adds another layer to your understanding of business performance.

Data View       CRM         ERP CPQ (Configuration/Quote Data)
Customer accounts and opportunity status X ✓*
Pipeline value and forecasted revenue X ✓*
Orders, fulfillment, and invoicing X ✓*
Financial reporting and actual margin (system of record) X X
Product configuration selections (options, variants) X X
Variant and option selection frequency during quoting X X
Configured products vs. products ultimately ordered X X ✓*
Quote pricing and estimated margin during quoting X X ✓*
Time between defined quoting lifecycle stages X X
Quote revisions and workflow progression X X
Channel-level quoting performance (direct vs self-service) X X

* Dependent on system integration and implementation setup.

6 things only configuration-level data can tell you

There are several questions that you can answer more easily when you have access to configuration-level data from your CPQ.

1. Why do certain product configurations close faster than others?

Consider a scenario where you want to understand which product choices actually help push deals forward, and why some quotes convert faster than others.  

ERP shows what was ultimately ordered. CRM shows pipeline stages and win/loss outcomes. What they don’t reveal is what happened during the quoting process: which variants or components are most often involved in slower deals? Were certain options hard to evaluate or validate, requiring sales to manually continue the process outside of their CPQ tool? 

Configuration-level data from CPQ can help you measure how long configurations remain in defined sales stages and which variants move from estimate to order more quickly. By comparing sales cycle duration and win rate across configurations, manufacturers can identify which product combinations consistently close faster.

2. How do specific product configurations impact margin?

It’s easy to link margin erosion to over-discounting or pricing changes. But even when sales teams follow pricing rules, margins can still decline. 

The reason is that margin is typically reported after the deal closes, and data is aggregated at the order or opportunity level. That view hides what actually happened during configuration. It doesn’t show how specific options or variants change cost structures, trigger downstream complexity, or force concessions during quoting. 

Manufacturers miss potential signals of margin erosion when they lack visibility into option-level tradeoffs. When margin is calculated in CPQ, you can surface average margin rate by configuration, territory, and attribute selection. With this information, you can identify which combinations consistently produce lower margin.

3. Which configurations increase the need for engineering support?

Why are orders that should have been “valid” still require engineering fixes?  

Your CRM and ERP won’t show which individual rules, overrides, or combinations caused revisions. Meanwhile, your CPQ data shows early indicators of configurations that push feasibility limits and lead more often to engineering issues.  

CPQ reveals configurations that experience longer sales cycle durations or lower win rates, giving engineering leaders visibility into where product complexity may be affecting commercial performance.

Now, your engineering team can analyze where products can be simplified or where additional guidance is needed.   

4. Which product variants are rarely sold, and should they stay in your portfolio?

ERP reports show what ultimately sells, but they don’t show which variants are technically available yet rarely configured, or which options are frequently explored but consistently removed before a quote is finalized. That behavior signals hidden complexity and features that add decision overhead without driving demand. 

Manufacturers struggle to rationalize their portfolios without visibility into how the full assortment is used during configuration. Configuration-level analysis exposes variants that are technically available but rarely or never sold. By comparing revenue, volume, and win rate across the full assortment, manufacturers can make informed decisions about which options to promote, adjust, or phase out.

5. How does product performance change based on configuration attributes or region?

Product performance is often analyzed by customer segment or region. While useful, those averages can hide meaningful differences in how specific configurations perform.

ERP and CRM data can show overall win rates or revenue by segment, but they don’t reveal how performance changes when a product is configured with specific attributes. When relevant conditions like application type, environment, or performance requirements are modeled as configuration attributes, CPQ analytics can measure how those selections impact win rate, revenue, margin, and sales velocity.

For example, a product with a 50% overall win rate may consistently achieve significantly higher win rates when paired with certain options or selected for a specific modeled use case or selected in a specific region.

Now, you can move beyond averages and understand where and why products perform best. In turn, this data informs more targeted guidance, positioning, and portfolio decisions. 

6. How can configuration data reveal emerging demand trends?

ERP and CRM data provide useful indicators of future demand based on past orders and deal outcomes across products and segments. 

Those signals, however, only appear once demand is already established. They don’t help teams spot emerging opportunities or adjust strategy before patterns show up in historical data. 

Decision-level insights at the time of configuration tell an additional story. By analyzing how many opportunities include specific configurations in early sales stages, and combining that with historical time-to-order data, manufacturers gain forward visibility into potential product demand before orders are finalized. That early signal of interest helps you identify growing demand for specific solutions sooner and adjust guidance, positioning, or portfolio decisions. 

Connect the dots across your data with Tacton

ERP and CRM will always be essential to understanding business performance, but they weren’t designed to explain how customer decisions and business requirements impact sales, margin, and product.  

Tacton CPQ allows manufacturers to visualize configuration and quote data directly in the platform, without the need for IT support or technical enterprise BI tools. With Insights & Analytics, you can quickly and easily see how quoting and configuration-level decisions influence business outcomes, so you can make portfolio and sales decisions that reflect what customers really want or need.  

Explore our CPQ analytics capabilities

Back to Resources

10 AI Data Security Questions to Ask When Evaluating CPQ Software

Before adopting AI-powered CPQ, manufacturers need clear answers on how their product, pricing, and customer data is secured.

10 AI Data Security Questions to Ask When Evaluating CPQ Software

From model hallucinations to cybersecurity breaches, AI adoption is a risky endeavor if your company doesn’t have AI security best practices in place. According to Accenture, 77% of companies are failing at AI data security as they continue to rush AI adoption without foundational security practices.  

Of over 200 surveyed manufacturers, low confidence in AI and its data is a core barrier to AI adoption. And as CPQ software—which continues to be a crucial part of the sales process—integrates AI into its capabilities, companies can expect to have more questions for vendors.  

These questions and AI security best practices make it easier to set up the guardrails you need to safely and securely reap the benefits of AI-driven CPQ.  

What is AI data security and why is it so important? 

AI is capable of processing vast amounts of data, from publicly available data to confidential, internal information. That may include personal identification details, product details, financial data, and other sensitive information. With so much data comes the risk of AI security vulnerabilities, including breaches, non-compliance, and errored outputs.  

As you adopt AI tools and integrate them across your digital systems and software, you are putting confidential information in the hands of your vendors. Your customers and your internal teams rely on IT leaders to evaluate and choose trusted partners that keep their information safe.  

10 questions and best practices for AI data security in CPQ software  

In addition to understanding available AI use cases in a vendor’s CPQ platform, it’s crucial to know a vendor’s policies around data security, especially if the company is using generative AI or LLMs.  

Start conversations around AI security with these essential questions. 

1. How is customer data handled when processed by AI features within the CPQ tool?

Start with what customer data is used by the AI algorithms. Understand the flow of that data through the system, as well as any governance practices that limit user access to sensitive data and clearly define where that data exists to prevent exposure. 

2. Does the CPQ vendor use any customer data to train AI models—either their own or third-party models?

Buyers should clarify whether their data contributes to model improvement and whether opt-out mechanisms exist to prevent data leaks. Your data should never be used to train public AI models. Consider what contractual guarantees exist to prevent data sharing with third parties, including model providers. 

3. Are AI models hosted in secure, enterprise-controlled environments or in public cloud AI systems?

When evaluating CPQ that uses generative AI and LLMs like OpenAI (ChatGPT), vendors should clearly state whether sensitive configuration, pricing, and product data is exposed to external, public environments. Work with CPQ partners that process data using enterprise-grade level environments or AI tools that keep all data within their internal environment.  

4. How does the vendor ensure compliance with relevant data protection standards?

AI tools must align with both global privacy requirements and internal corporate governance. AI data security regulations are often more stringent in the European Union, for example, than in North America. Different divisions and regions may have different data security regulations, such as the AI Act in the EU, which are important to be aware of if you are a global company.  

Helpful follow-up questions:  

  • How is it ensured that my data remains within the EU (for global or European businesses)? 
  • Are all AI interactions logged for audit and compliance purposes? 
  • Are your AI services compliant with GDPR / CCPA / ISO 27001 / SOC 2? 


These certifications signal whether a vendor has independently audited, repeatable security processes in place. Buyers should confirm that compliance applies not only to the core CPQ platform but also to all AI components, including sub-processors and model providers. Ask whether the vendor supports data residency requirements (e.g., EU-only processing), maintains audit logs, enforces role-based access controls, and provides documentation for security reviews. 

5. What mechanisms are in place to ensure human oversight of AI-generated outputs?

Garbage in equals garbage out, no matter how secure your AI CPQ software data may be. First, verify with your internal experts that your data used by the AI is clean and consistent—an important step for all companies adopting AI. Then, ensure that AI suggestions, configurations, or automated content are validated before being used in sales or engineering processes. All outputs generated by the CPQ vendor should be subject to human review for internal quality control to prevent hallucinations and other errors.  

Helpful follow up question:  

  • Who owns outputs created by AI, the customer or the vendor?  


AI is not a person, so who owns its outputs? AI output can be considered intellectual property, which means that suggestions, documentation, or configuration assets may be property of the CPQ vendor rather than the customer. Ensure you are the owner of AI outputs, especially if those outputs are to be patented or commercialized.  

6. What encryption and security practices protect data during storage, transmission, and AI processing?

Buyers should look for a vendor that can clearly describe how data flows, where it is encrypted, who can access it, and how the environment is monitored. Is data encrypted in both transit and at rest? Vendors should also monitor AI environments for anomalies, unauthorized access attempts, or unusual model behavior. If vendors have appropriate role-based access and segregated environments, there is less probability of misuse or external access.  

7. What level of transparency does the vendor provide about the AI system’s behavior, limitations, and decision logic?

AI-enabled CPQ shouldn’t be a black box. Can your CPQ vendor easily explain the types of AI algorithms and logic rules that are used? Does it use a mix of symbolic AI and generative AI to improve trustworthiness? Understanding how the AI arrives at recommendations is critical for trust and auditability. 

8. How does the vendor manage model updates, patching, and lifecycle governance to ensure ongoing security?

AI models evolve, so companies should know how updates are applied and validated. Equally, if your vendor is not consistently investing in modernizations and improvements to its capabilities and platform, it may be time to look elsewhere.  

Helpful follow-up questions:  

  • How are updates to the AI model made, and how are customers notified? 
  • Are the AI functionalities AI-native or AI-enabled? 


AI-native capabilities are built directly into the core CPQ architecture, ensuring unified governance, security, and consistent use of product logic. AI-enabled (“bolt-on”) features often rely on external components, which can introduce additional data transfers, limited governance, and higher security risks. 

Ask whether: 

  • AI runs within the same rules engine 
  • It depends on external orchestration tools 
  • Product logic is governed centrally or duplicated across service 
  • Safeguards are built into your architecture to switch models or rebalance cost/performance without disruption 


These questions address fears about model vendor lock-in, AI regulation changes, and tech bubble volatility for long-term data security.  

9. What technical safeguards exist to prevent inaccurate, biased, or non-compliant AI outputs from entering customer-facing quotes?

Buyers should confirm that the CPQ vendor has technical, automated safeguards that prevent the AI from generating outputs that violate or override product rules, pricing policies, compliance requirements, or accuracy standards. Unlike human oversight, these safeguards are built directly into the system and ensure that AI-generated recommendations are always validated against the product model, pricing structures, and regulatory logic before they appear in a quote. This avoids, for example, a potential regulatory issue or an unauthorized discount. 

10. How is the CPQ vendor using AI in its own internal operations?

This question often goes overlooked. But it’s a major red flag if an AI-driven CPQ company is not operationalizing AI within its own teams. When a company uses AI to drive its own efficiencies and innovations—especially operationalizing an AI use case internally before marketing it externally—then you know they have full confidence and trust in their AI capabilities.  

Keep your data secure in AI-enabled CPQ 

Tacton CPQ AI capabilities protect your product, pricing, and customer information across tools like AI Product Modeling and configuration assistance. We combine enterprise-grade security with human oversight, so you can innovate and sell highly configurable products with confidence. 

Learn more about AI-driven selling 

Index