Blog

Mastering Mass Customization: Best Practices for Increasing Configure-to-Order Coverage
A practical roadmap for shifting from 100% engineer-to-order to increased configure-to-order manufacturing, reducing complexity and scaling sales with better margin.
Make B2B Self-Service Ordering Easy with Tacton Self-Service Channels for Manufacturers
Learn how Tacton’s new Self-Service Channels makes it easier than ever to launch a self-service online configurator for complex products.

Engineer-to-Order vs Configure-to-Order: How to Find the Right Balance in Complex Manufacturing
How much of your business truly needs fully engineered-to-order products? Learn how to strike the right balance and uncover hidden CTO potential.

How to Measure Product Portfolio Performance in Complex Manufacturing: Metrics to Track
Product portfolio optimization helps manufacturers improve margins and reduce complexity by using configuration-level data to evaluate deeper product performance.

6 Things Your ERP and CRM Can’t Tell You About Sales and Product Performance
ERP and CRM show what happened in your sales process, but configuration-level data from CPQ reveals why deals move or stall.

10 AI Data Security Questions to Ask When Evaluating CPQ Software
Before adopting AI-powered CPQ, manufacturers need clear answers on how their product, pricing, and customer data is secured.
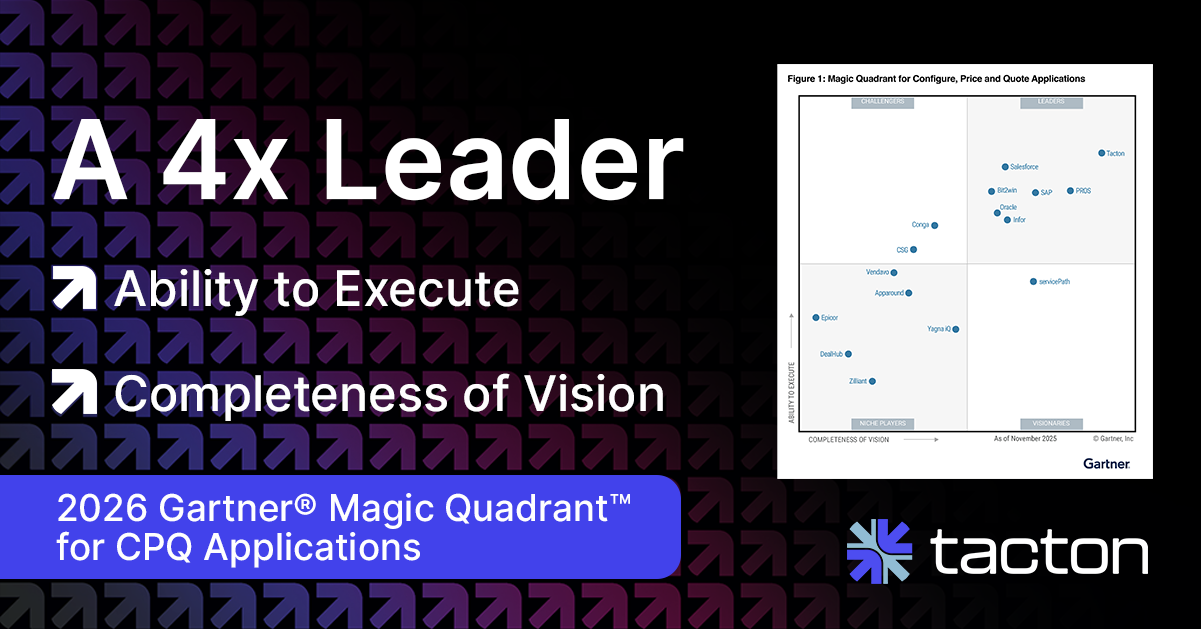
Tacton Named a Four-Time Leader in the Gartner® Magic Quadrant™ for CPQ Applications
Tacton’s perspective on the 2026 Gartner® Magic Quadrant™ for CPQ Applications.

Enterprise CPQ for Complex Manufacturing: What It Takes to Scale Successfully
Enterprise CPQ goes beyond faster quotes. Build a scalable operating model that supports growth across your business.

Generative AI Best Practices in Manufacturing: The Dos & Don’ts for Smarter Quote-to-Order
Manufacturers are eager to adopt generative AI, but many still struggle with trust, risk, and realistic expectations. These practical guidelines help manufacturers avoid risk and set realistic expectations.

How to Respond to Manufacturing RFQs Faster with AI Sales Assistance
RFQ response time is now a competitive differentiator for customers who expect a fast and seamless buying experience. AI sales assistance can transform how manufacturers respond to high RFP volume.

The Digital Thread in Manufacturing: Connecting Data Earlier Across the Lifecycle
By connecting customer intent and configuration data early to the product lifecycle, manufacturers extend the digital thread across sales, engineering, and production.

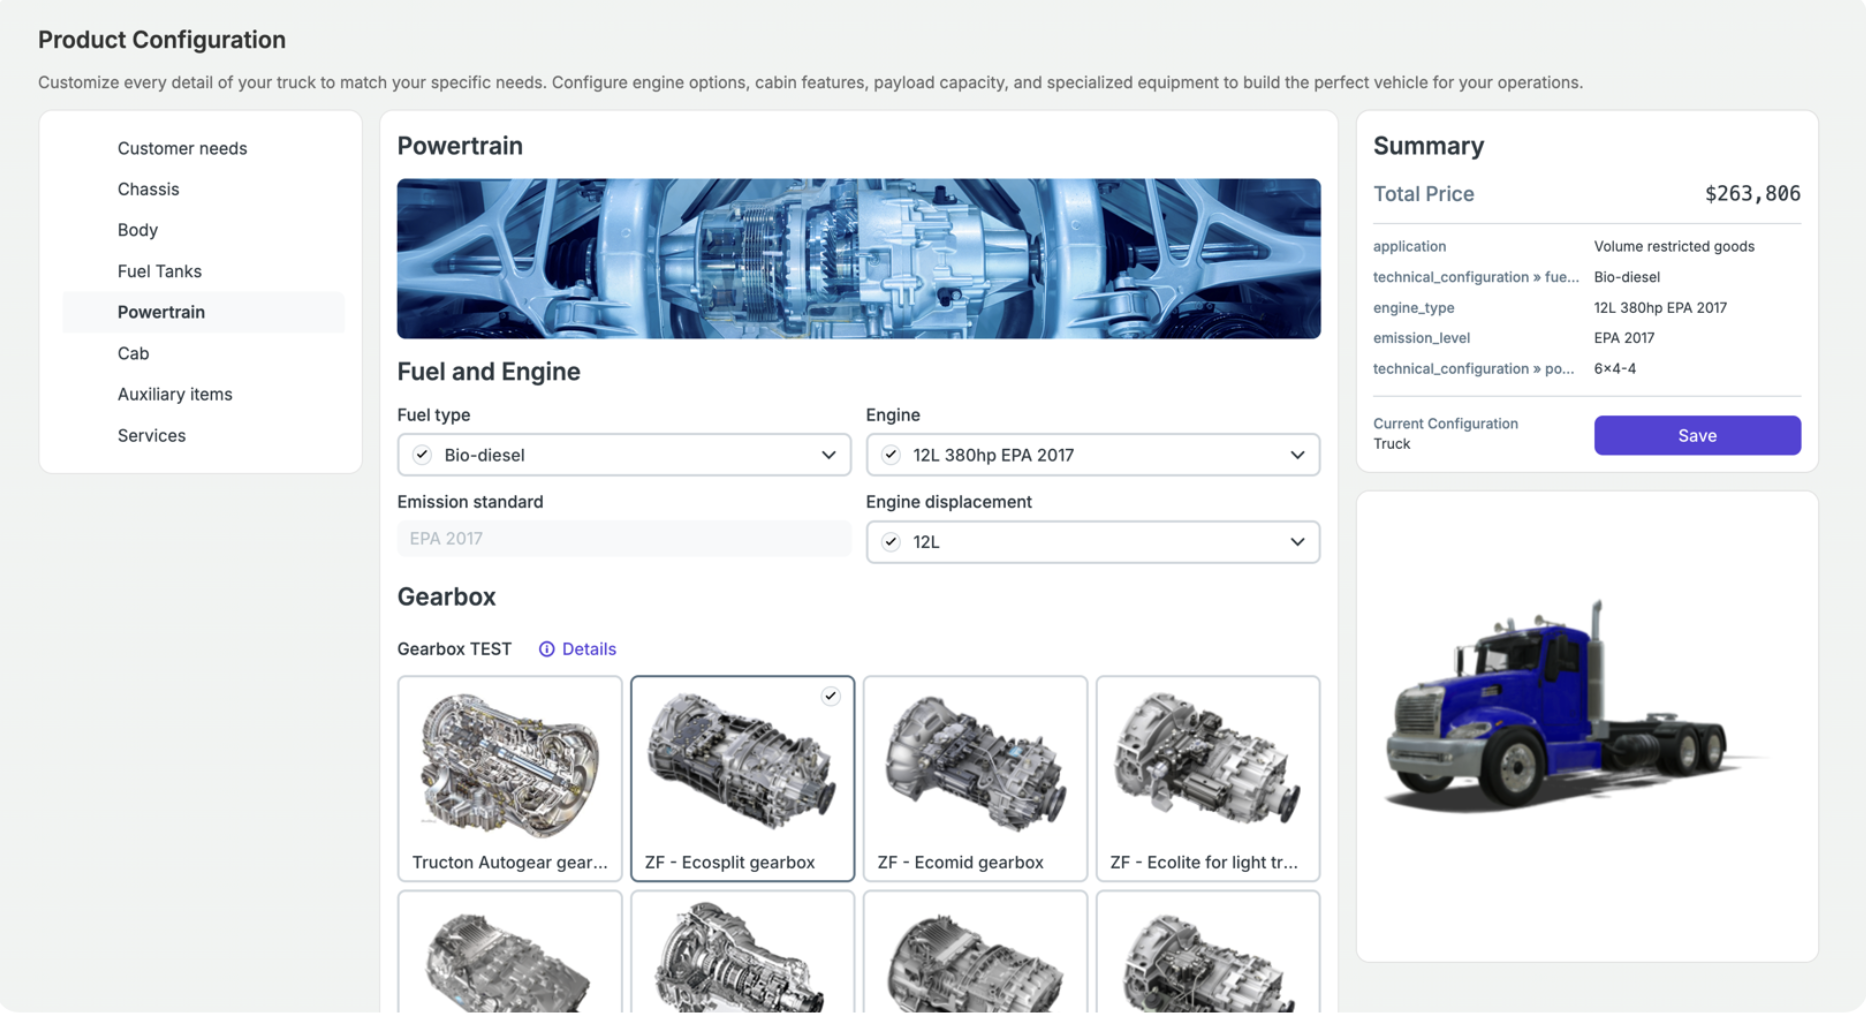
How Tacton’s 3D Product Configurator Solves These Manufacturing Sales Challenges
A 3D product configurator gives manufacturers a faster, more accurate, and more intuitive way to sell complex products by dynamically visualizing every configuration. Learn how Tacton's visualization capabilities embedded in CPQ accelerate your sales.