A note about the author: This week’s author is Marco Lang, Tacton’s Senior Visualization Product Manager. Marco has more than 10 years’ experience working with visual asset creation, and configuration at Lumo Graphics, and now Tacton.
Showcasing your manufacturing product to buyers is an important aspect of the sales pitch for your company. Many companies lose opportunities because they rely heavily on text-based descriptions of products. That’s why it’s as important as ever to add visual configuration to your sales pitch. (Read the basics of visual configuration)
Visual representations of your products, services and brand are key drivers of online engagement. Digital assets link your customers and company by giving a way to accurately interact with your products.
In this blog, we’re going to take a deep dive into the visual asset creation process and how putting in the time on the back end will ultimately benefit not only your sales team but most importantly, your customers.
Digital Twin
A Digital Twin is a digital model of a physical counterpart (product, system or process), describing its characteristics, attributes and behaviors. Or to be more precise, a Digital Twin is the link between a Digital Master (Master Data or Template) and a Digital Shadow representing a unique relationship to a specific real-world counterpart.
This virtual representation dynamically collects and combines data from the field as the counterpart matures along the different life-cycle stages. Business systems such as data from engineering, manufacturing, marketing and sales sensor data from operation to service and maintenance. This connection allows new ways of analysis, simulation, optimization, prediction, monitoring, documentation and communication for increased operational efficiency.
A Digital Thread
Learning and growing by capturing data from the past and current behavior creates a Digital Thread representing the birth-to-retirement records of the product as it moves through its lifecycle.
Depending on the use case or the goal of a Digital Twin (e.g. manufacturing, operation or service, …), different kinds of data is collected on a Digital Twin.
Visual representations (3D Models), as part of a Digital Twin, enable the end-user to evaluate the product by looking at its shape, form or fit and analyzing and understanding its features, options and constraints.


(Image showing form, fit and function use cases of visual representations)
Configuration-compatible 3D real-time Models build the core of Tacton’s Visual Configuration solution.
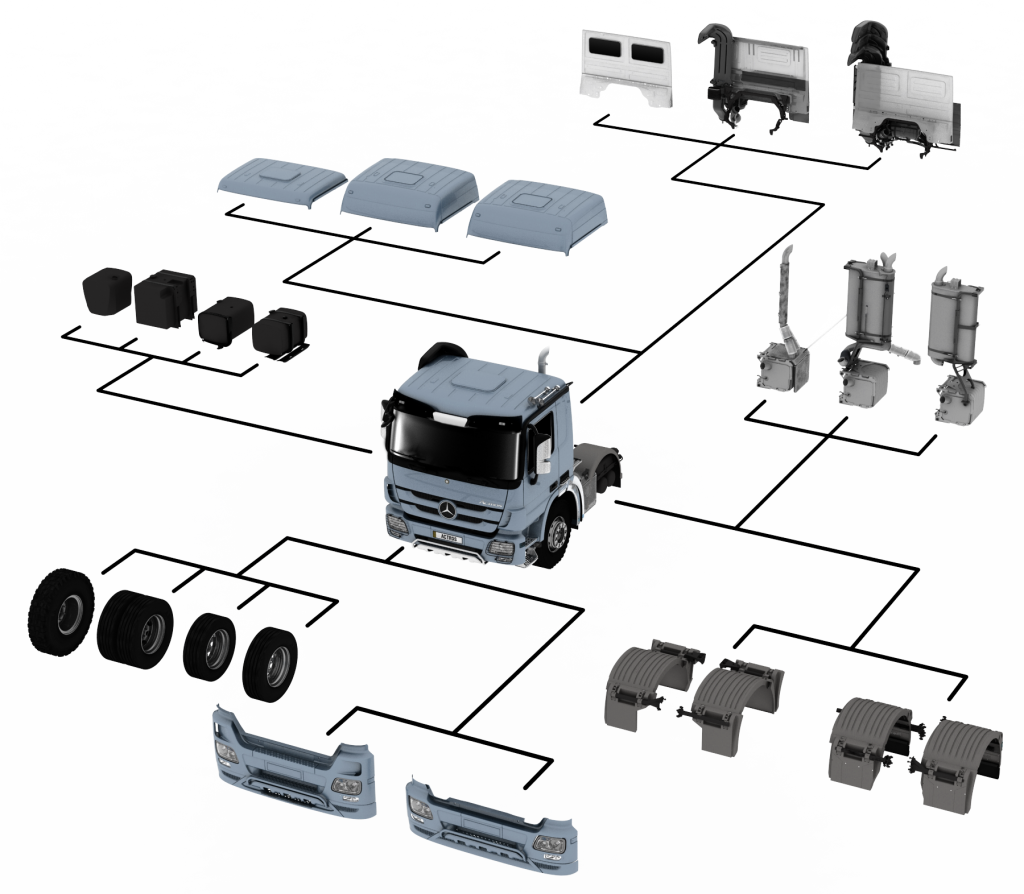
(Image of some configuration possibilities of a truck)
Visual Assets
All data and files that are necessary for a configuration-compatible 3D real-time visualization are referred to under the umbrella term “Visual Asset”.
Important Visual Assets are:
- 3D Models
- 3D Scene with its environment
- Materials and Textures
3D Model (Mesh/Geometry)
A polygon-based model representing the product’s shape and components in 3D.


(Image of a polygon-based model of a teapot)
3D Scene
The virtual 3D scene defines the scenery in the 3-dimensional world the product is put in. This includes the environment/surrounding, lighting and cameras to look at the product.
The environment can be a simple Background image or a complete 3D surrounding adding additional 3D models to the visualization. Check out how we do it with our Tructon or Parker Lift Demos.
Lighting in a virtual 3D world is as essential as it is in real life. Without any lighting it is dark and the product is not visible at all. Therefore, Lighting is a crucial part in setting up a virtual 3D scene.
There are two ways of lighting. Gathering the information from a 360° high dynamic range image (HRDI) or by setting light with specific light types and their individual properties like in a real photo studio.
Cameras define the different viewpoints on a product in the scene, often along with interaction possibilities and constraints like degrees of freedom and distance/zoom restrictions.
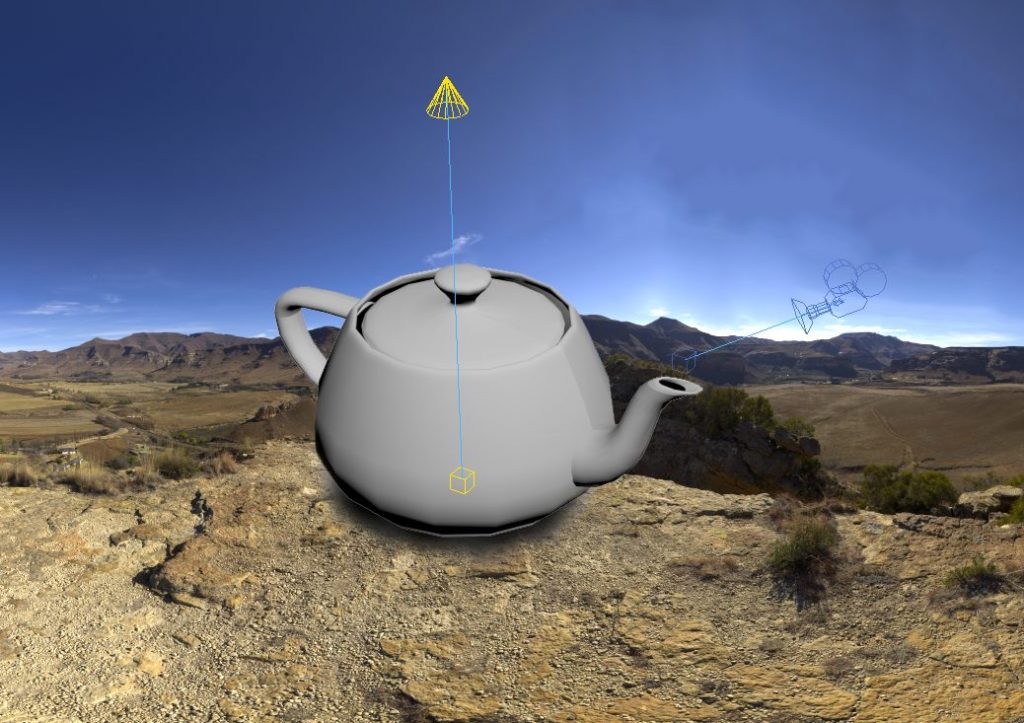
(Image of different scene elements like light, camera and environment)
Material
While 3D Models define the shape of an object, Materials define the surface properties and therefore the look and feel of the object in the scene. Depending on the underlying calculation models and their parameters the visualization can range from simple colors to real-world looking surfaces approximating real-life lighting behaviors, for example by using Physical Based Rendering.


(Image of a teapot with two different materials)
Texture
Textures are images used by Materials to help create realistic materials. They help to add details and real-life variations of materials over a surface. Those images can be created from scratch in dedicated applications or retrieved from real-life photographs.
In many cases, it can be helpful to simulate e.g. heights or small details on a surface via textures to keep the overall performance of the visualization as high as possible.

(Image of materials using additional textures for diverse looks)
End-User Constraints to Consider:
System capabilities
Since 3D visualization is executed on the customers’ device, (think cell phone or tablet) the performance of the system is critical to the experience.
Although there have been huge improvements in consumer hardware (graphics cards) and platform capabilities (native and browser applications) over the last few years, there is still a very disconnected technology landscape out there.
Less capable systems prevent the usage of optimized functionalities. And if a device doesn’t support the amount of data necessary for the visualization, the visualization will not be complete or not showing anything at all. Therefore, experiences are typically designed to work well on the lowest common denominator.
Download speed
Since all necessary visual assets need to be transferred to the users’ device to get displayed by the visualization, the amount of Visual Assets, the internet connection speed and stability is affecting the experience as well, especially the initial loading time till the visualization is visible for the first time. The bigger the visual assets are used or the slower the connection is, the longer it takes to download the content and to start the experience.
Rendering Performance
Depart from the capabilities of the underlying system, the rendering performance depends on other criteria as well, like Visual Asset Weight and the resulting Visual Fidelity (Realism).
Visual Asset Weight refers to the “complexity” of the Asset. The important performance measurement for 3D Models are the number of polygons those models are composed of. The higher the number of polygons, the slower the performance of that 3D model. Lightweight assets are 3D models with a low polygon count.
Besides the individual weight, the actual number of different objects in the scene can be a very crucial factor as well. Many different objects with different materials typically relate in a higher number of Draw Calls on the graphics card, impacting the rendering performance since more work needs to be done.
For Texture, the weight defines the dimensions and the texel variety within the texture. For Materials the weight defines the complexity of the underlying shader, referring to the number of textures combined and the complexity of the underlying algorithms.
Optimizing your visual asset creation is essential to a good end-user experience. Part 2: Optimizing Visual Asset Creation will be available tomorrow. In the meantime, why not check out our eBook Seeing is Believing: Visualize the Future of Manufacturing Sales or check out our latest 3D visualization software video.